Once you have prepared the data and have been able to visualize it, you’re ready to take the next logical step: to analyze the data for both Artificial Intelligence and Business Intelligence. This lab will help you develop analytical graphs and charts along with predictive analytics. You will dabble with the AI models used for the predictions.
Starting off from the PowerBI dashboard built in the previous lab, you will now add analytical capabilities to the dashboard.
You will be able to build correlations between various data sets, develop analytical insights, and see the predictions being made by the AI model underneath.
You will also be exposed to AI model development and model serving abilities of Azure ML
This lab will show you how to set up an automated machine learning (AutoML) training job with the Azure Machine Learning Notebook. Automated ML picks an algorithm and hyperparameters for you and generates a model ready for deployment. This lab provides details of the various options that you can use to configure automated ML experiments.
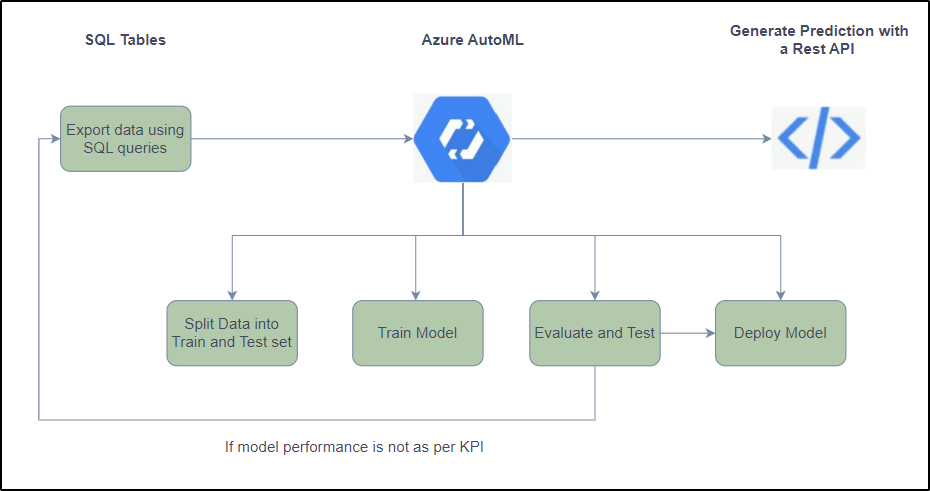
The basic flow diagram for this lab is outlined below. It shows the activities we’ll be performing as part of this lab, starting with exporting the dataset required to train the models from Azure SQL Database, and then building an AI/ML model using Azure ML Studio.
Note: The AI ML models built in this lab are not ready for production; we’re only using 4 years of Chicago Crime data for the model training. Hence, the prediction is done using a python notebook.
Getting Started: Set up AutoML training with the Notebooks
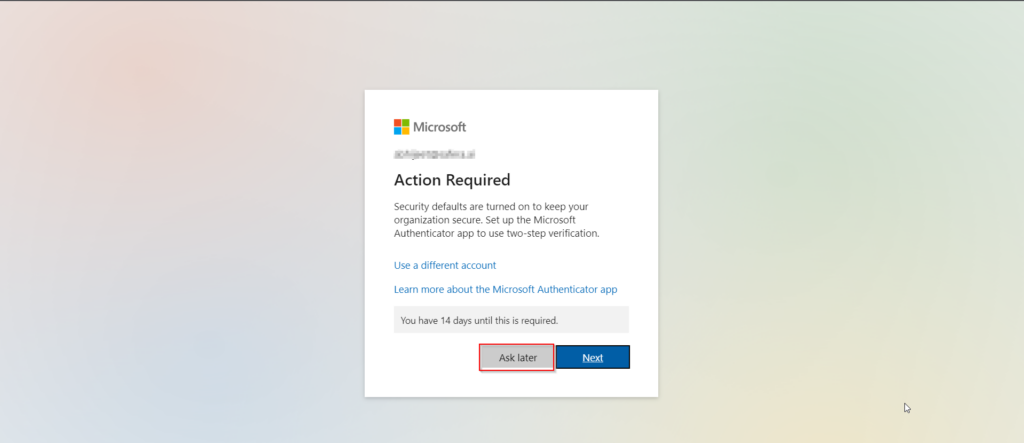
3. You might see a prompt like the one pictured below, Click on Ask Later (Note- Whenever you find this prompt click on the Ask Later option)
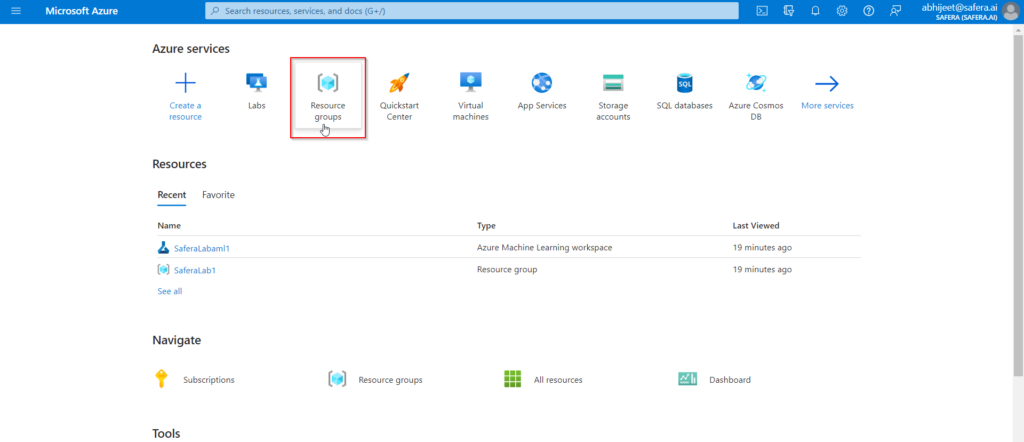
4. Once you are signed in to azure portal, click on the Resourse groups tab, to select the required resourse.
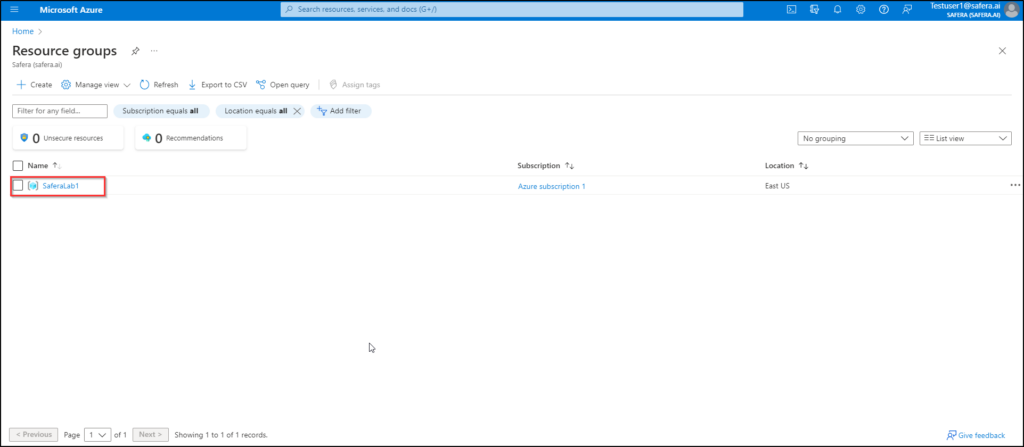
5. Select the SaferaLab1 resourse group.
NOTE: The ID will be different for each user. For instance,
a) For user1, the resource group name will be SaferaLab1.
b) For user2, the resource group name will be SaferaLab2 and so on.
Below is the screenshot for User1:
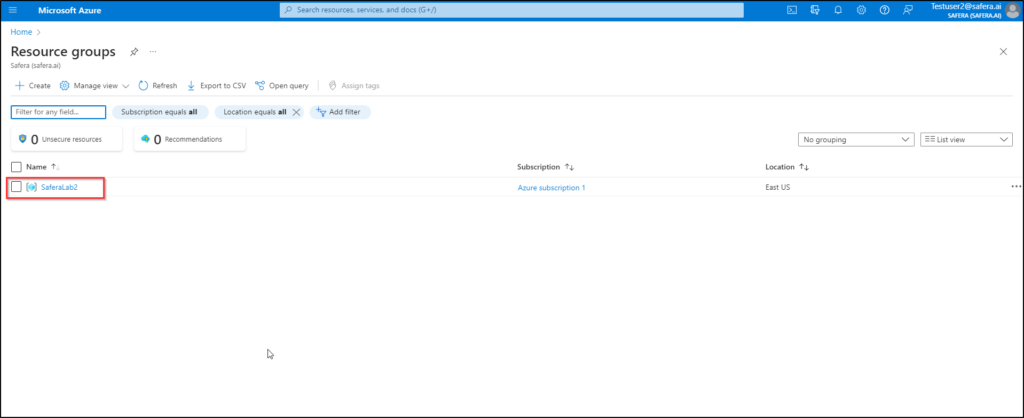
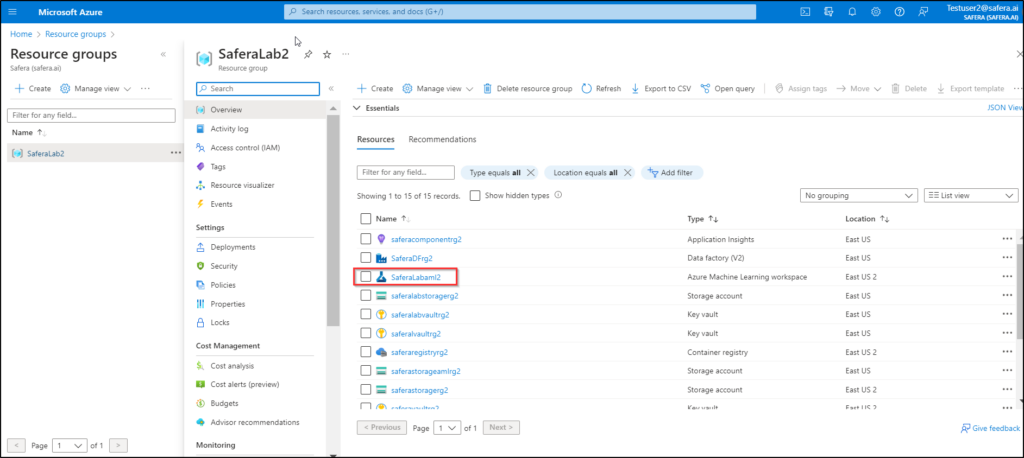
Below is the screenshot for User2:
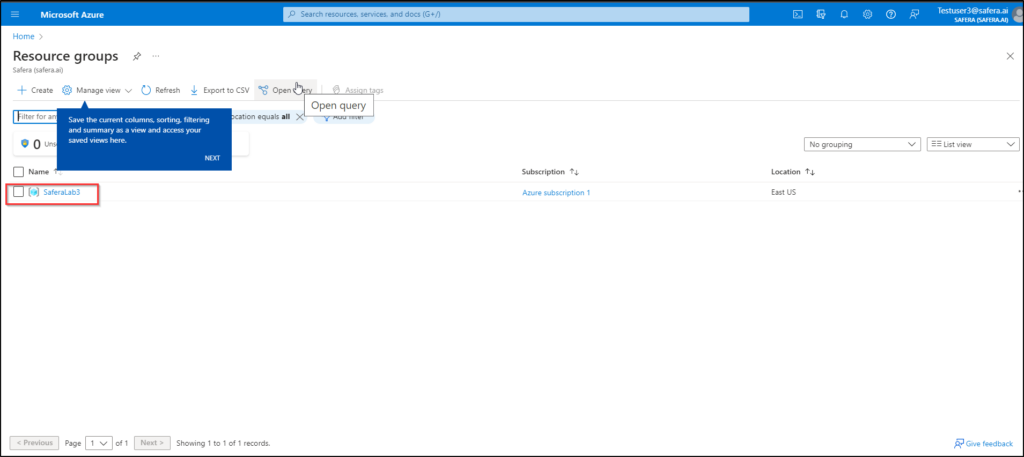
Below is the screenshot for User3:
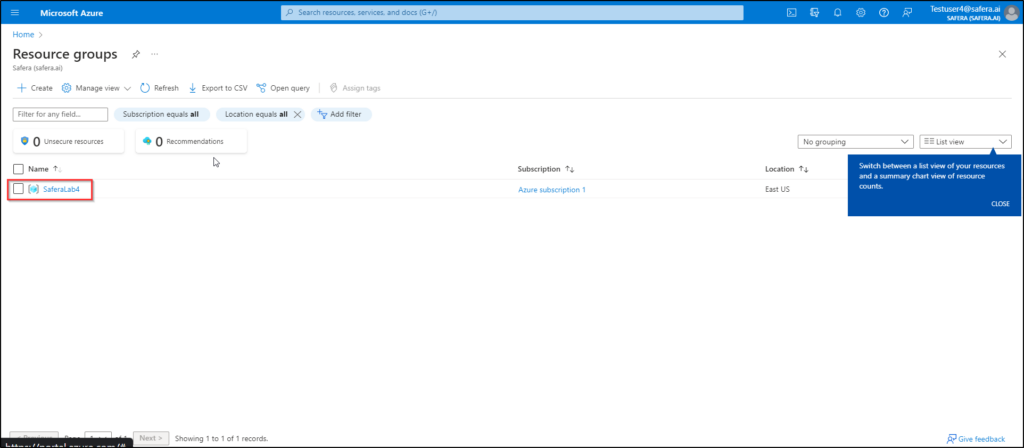
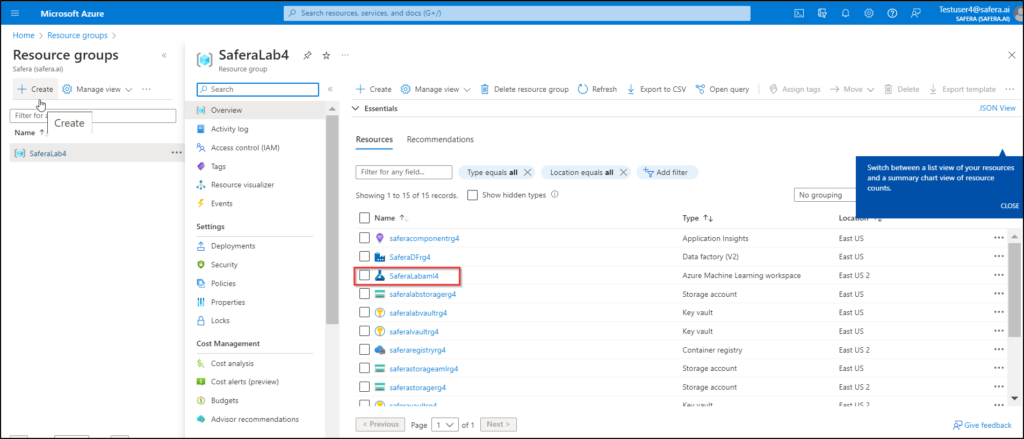
Below is the screenshot for User4:
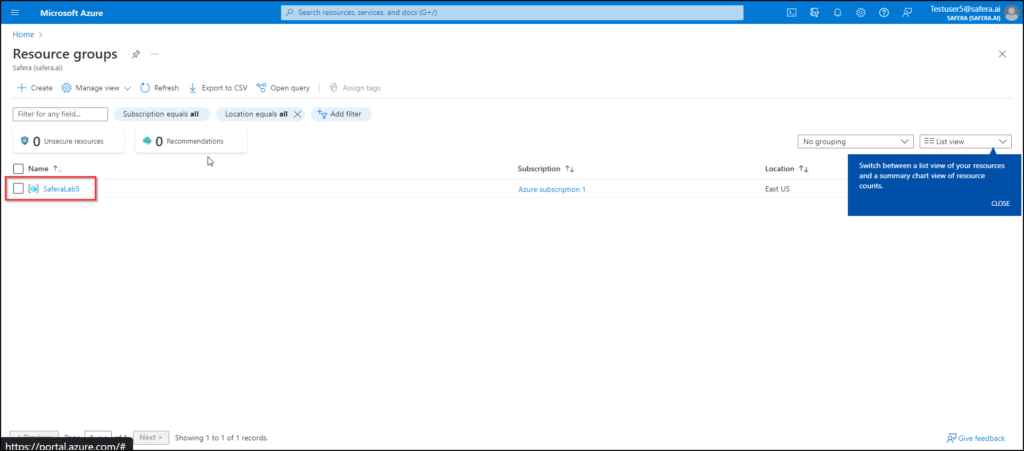
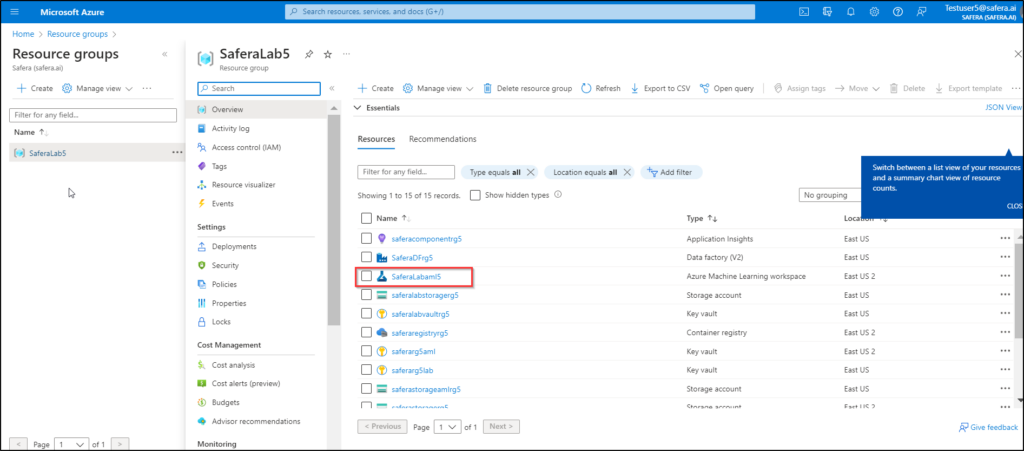
Below is the screenshot for User5:
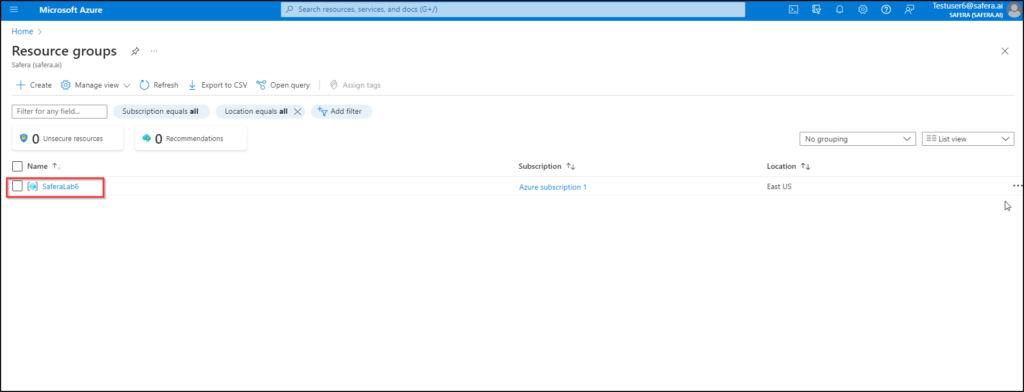
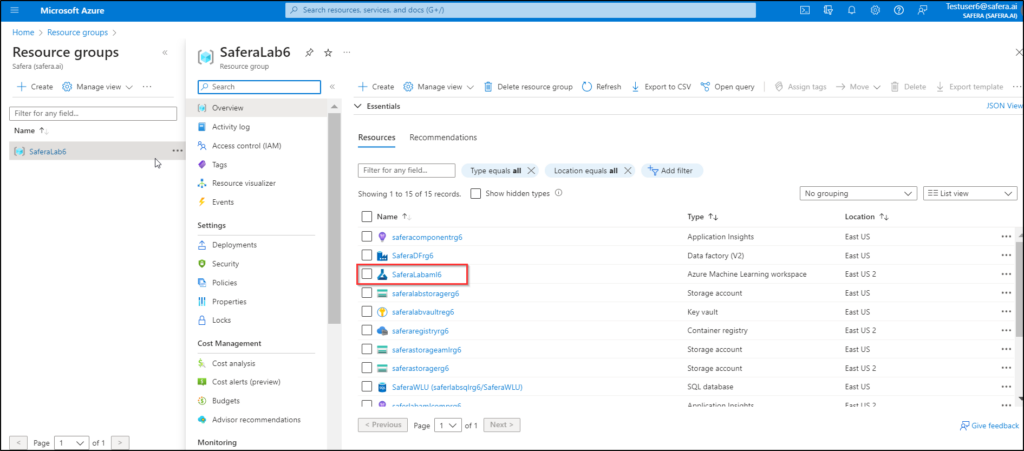
Below is the screenshot for User6:
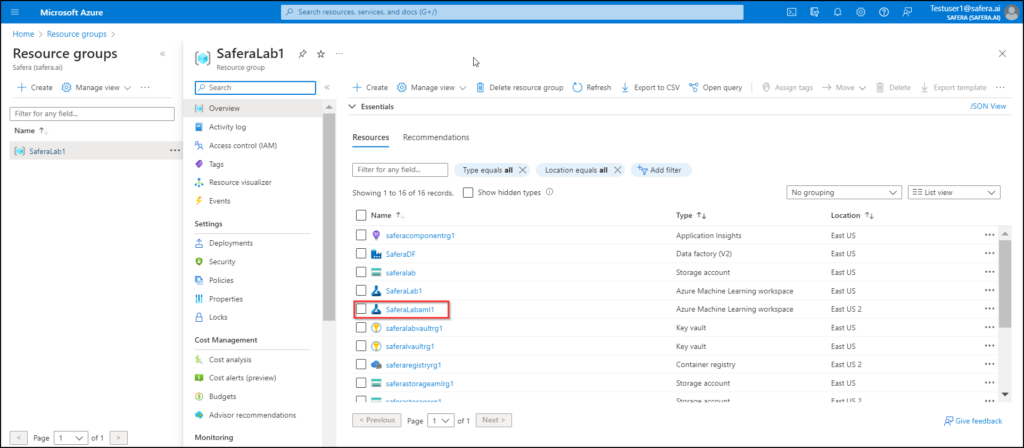
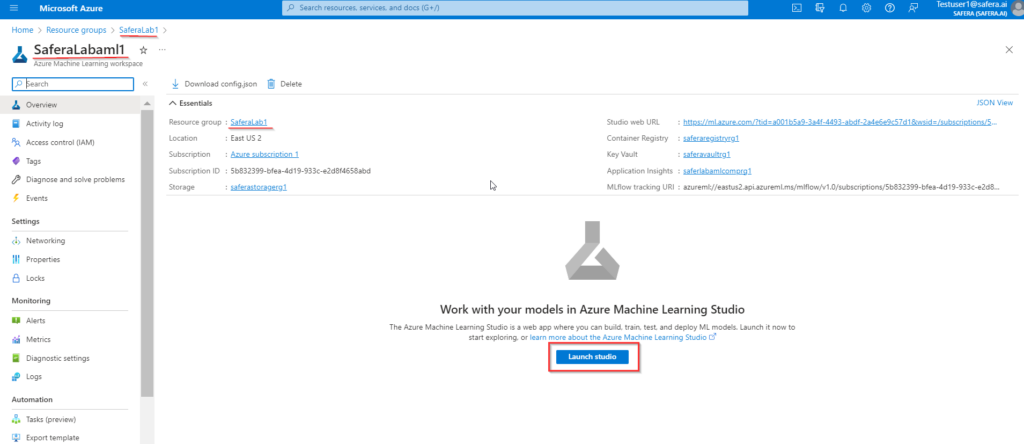
6. Once you’ve selected the SaferaLab1 Resource group, select the SaferaLabaml1 workspace from the list. If you’re having difficulty finding it you can type “workspace” into the “Filter for any field” input and you’ll only be shown workspace resources.
NOTE: Similar to the pointer mentioned in the previous step, the ID will be different for each user. For instance,
a) For user1, the studio workspace name will be SaferaLabaml1.
b) For user2, the studio workspace name will be SaferaLabaml2 and so on.
Below is the screenshot for User1:
Below is the screenshot for User2:
Below is the screenshot for User3:
Below is the screenshot for User4:
Below is the screenshot for User5:
Below is the screenshot for User6:
All the screenshots given below are with respect to the User1. Kindly select the respective resources and notebook folder for further steps.
7. Once you’re in the SaferaLabaml1 workspace, you can click on “Launch Studio” towards the bottom of the screen. It will open up a new tab in your browser.
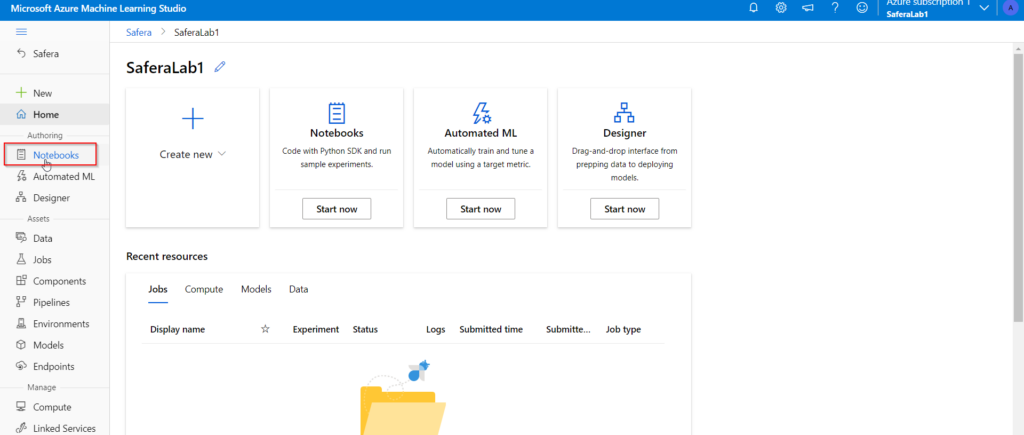
8. Navigate to the left pane. Select Notebooks under the Authoring section.
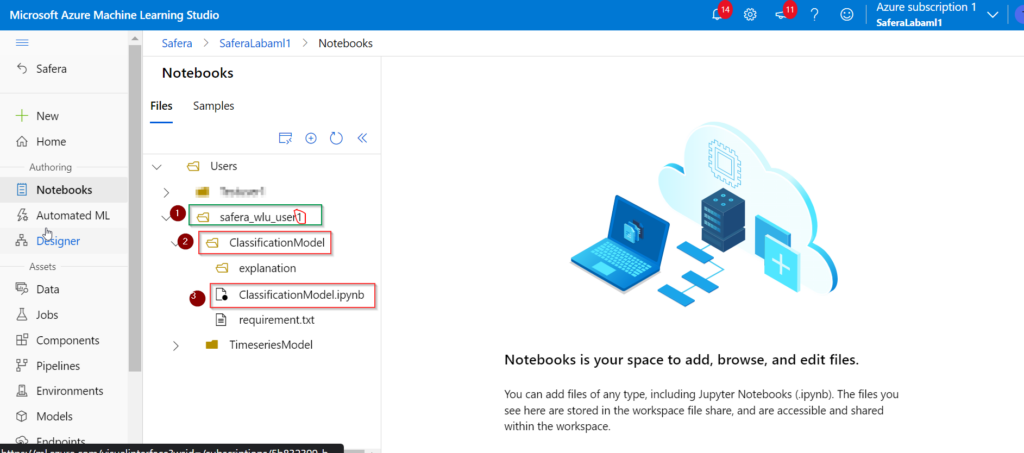
Model 1 : Crime Type Prediction (ClassificationModel)
Open the Notebook file as follow :
For User2, the first folder name would be “safera_wlu_user2” instead of “safera_wlu_user1”.
For User3, it would be “safera_wlu_user3”.
For User4, it would be “safera_wlu_user4”.
For User5, it would be “safera_wlu_user5”.
For User6, it would be “safera_wlu_user6”.
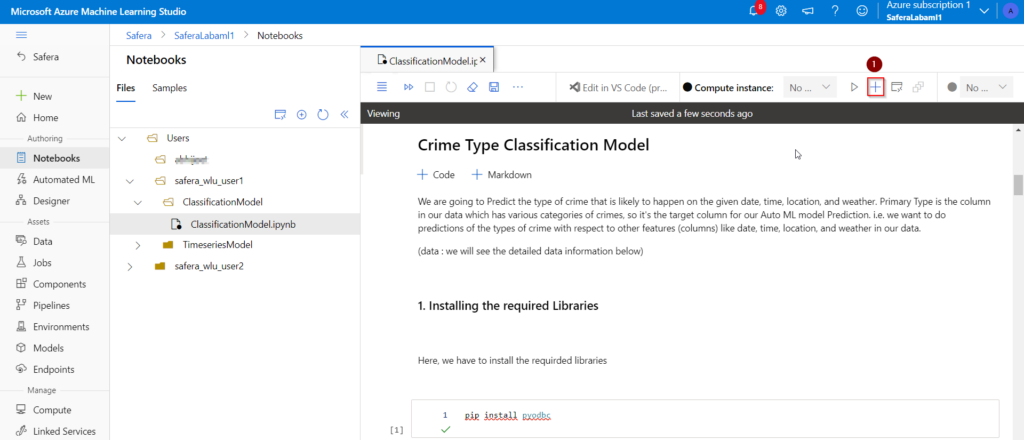
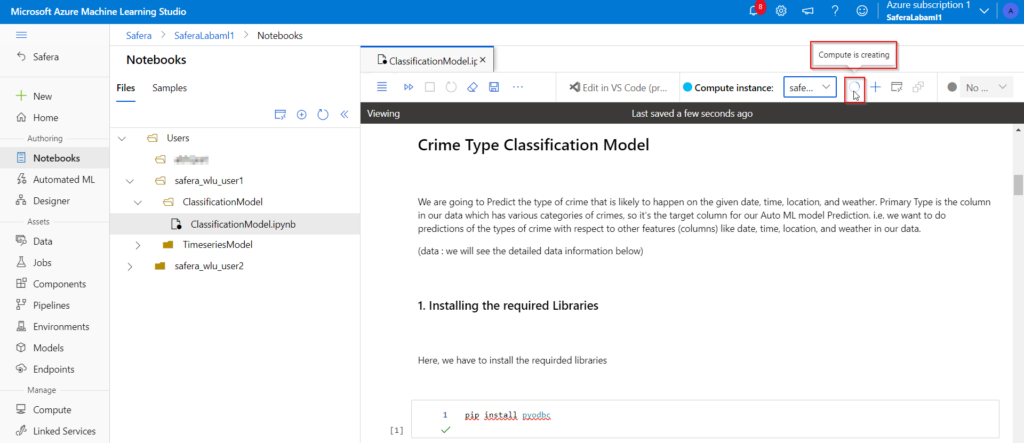
2. Once you open the Notebook file, Click on the + button present at right side as shown in the image to create a compute instance.
3. Click on the Create button
4. It will take a few minutes(3-5) to create a compute instance.
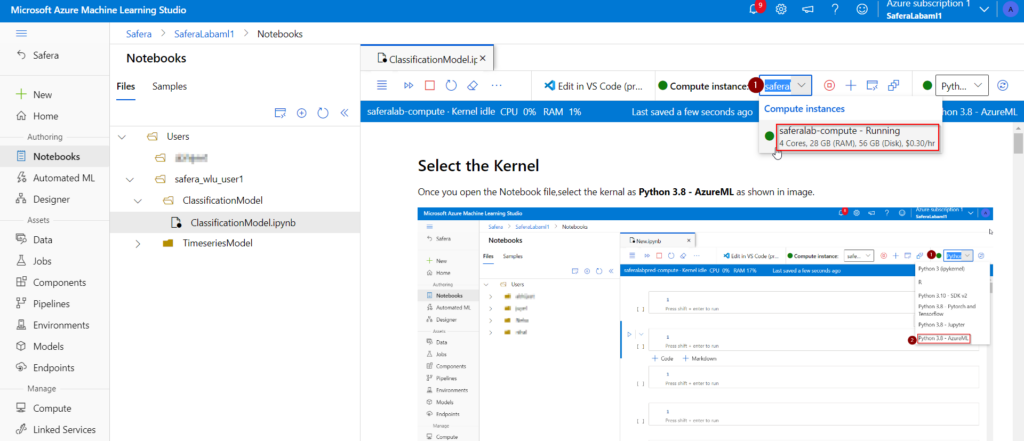
5. Once the compute created, you can see the created compute instance in green colour.
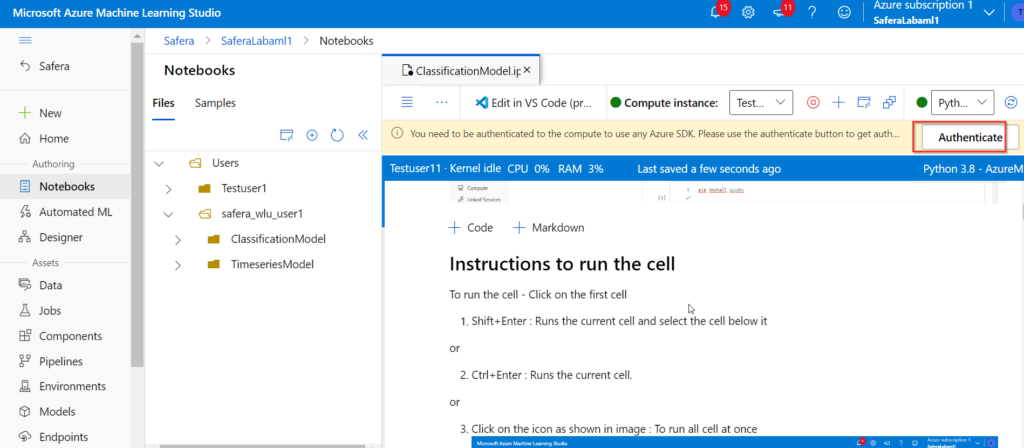
(if asks for authentication permission, click on the Authenticate button)
6. Click on Authenticate button to enable use of Azure SDK.
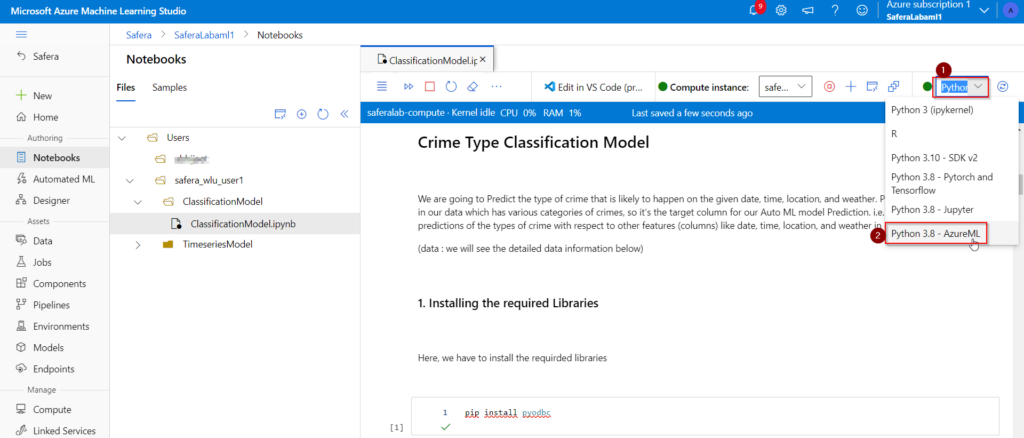
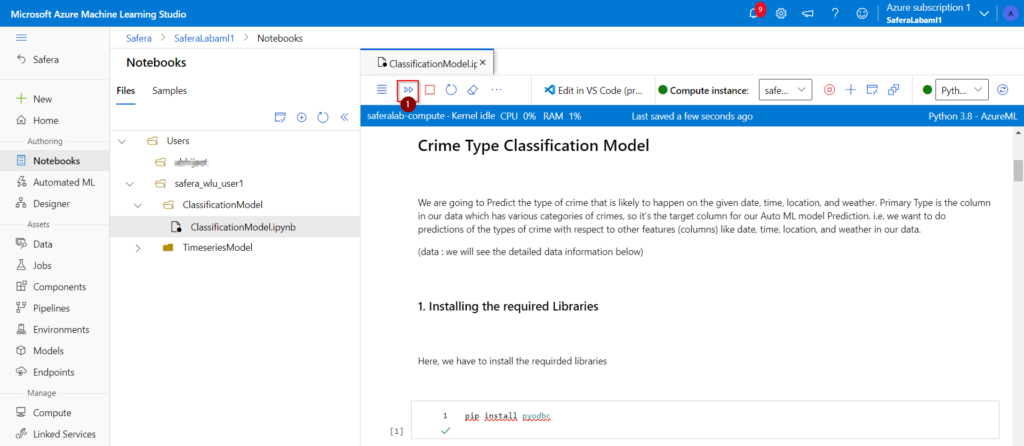
7. Select the kernal as Python 3.8 – AzureML as shown in image.
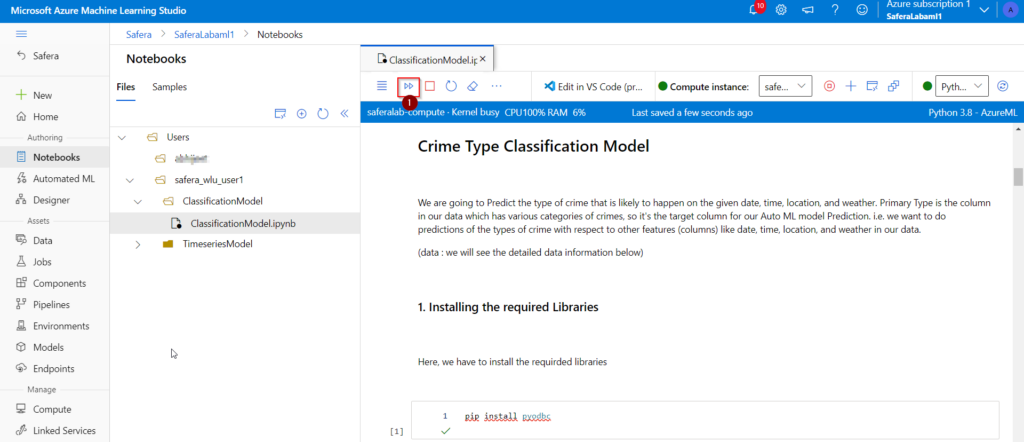
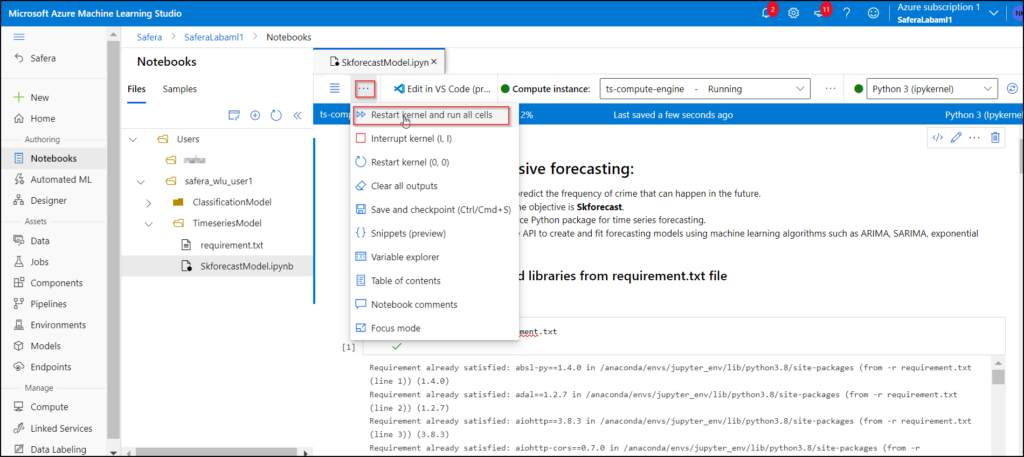
8. So, Click on the “Restart kernal and run all cells” button. This will run all the cells in the notebook.
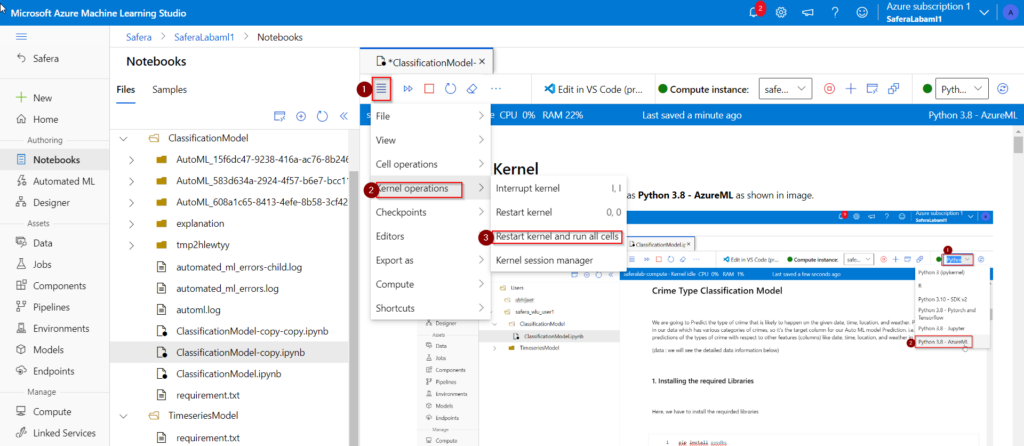
if you didn’t find that icon, then you can use this method to “Restart kernal and run all cells”
Instructions to run the individual cells. – Click on the cell that you want to run (You should always run it sequentically)
1. Shift+Enter : Runs the current cell and select the cell below it
or
2. Ctrl+Enter : Runs the current cell.
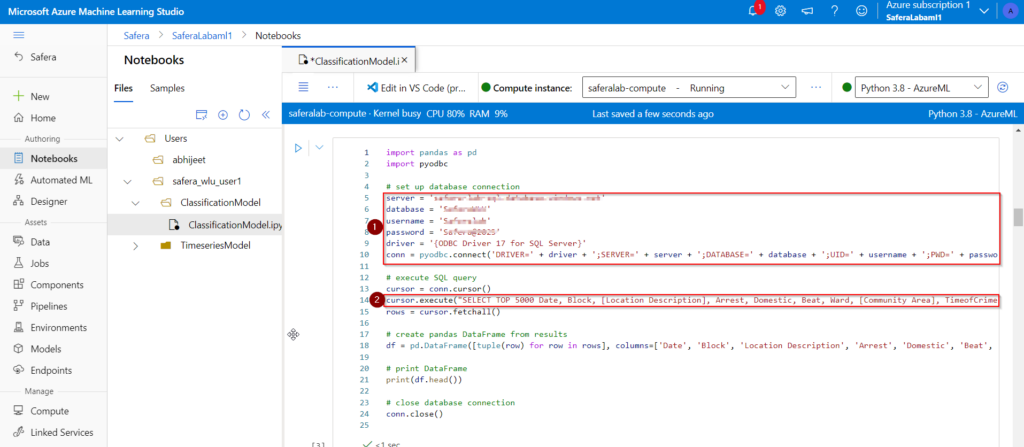
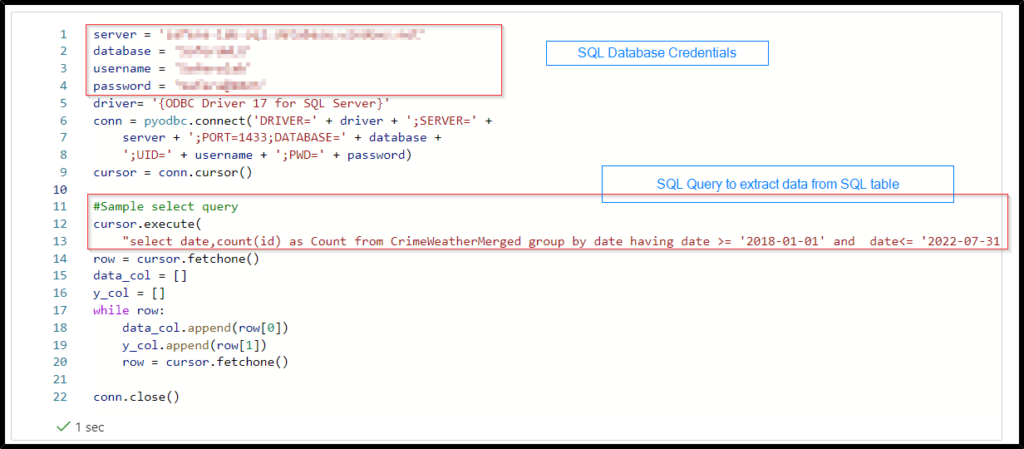
Model 1: Export dataset from SQL Database Connection
from above image
SQL Database credentials
Query to get required data
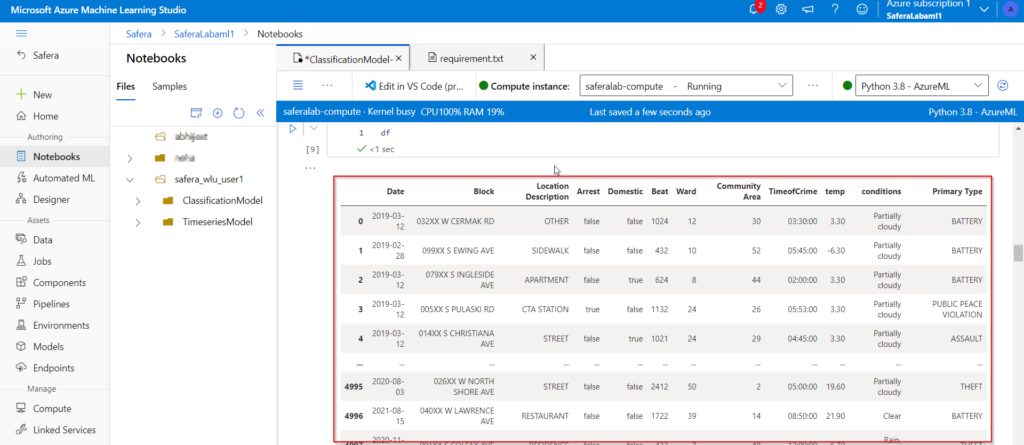
Data information
Date: For which we need to see the prediction.
Block : The partially redacted address where we need to look for the possibility of a crime happening.
Description of the location: For Instance – Residence, Sidewalk, Apartment, Residence, Grocery Food Store, Street.
Arrest : Indicates whether an arrest was made.
Domestic: Indicates whether the incident is domestic-related as defined by the Illinois Domestic Violence Act.
Beat: Indicates the beat where the incident occurred. A beat is the smallest police geographic area – each beat has a dedicated police beat car. Three to five beats make up a police sector, and three sectors make up a police district.
Ward: City Council District
Community Area: Indicates the community area where the incident occurred. For instance: Chicago has 77 community areas.
Time of the Crime
Average Temperature of the location
conditions : Weather condition
Primary Type (Target Column) : Type of crime ex. BATTERY,THEFT,PUBLIC PEACE VIOLATION,ASSAULT etc
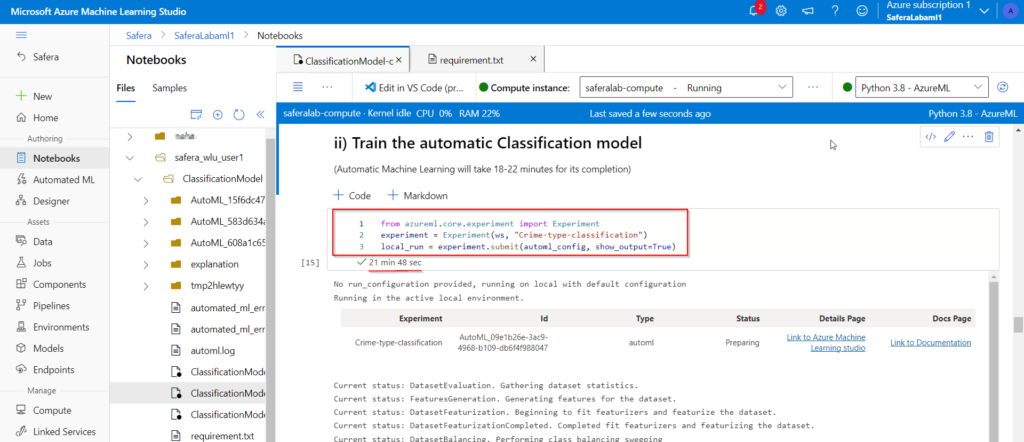
Model 1: Training
Here, we are training the Model using Azure AutoML library. (Automatic Machine Learning will take 18-22 minutes for its completion)
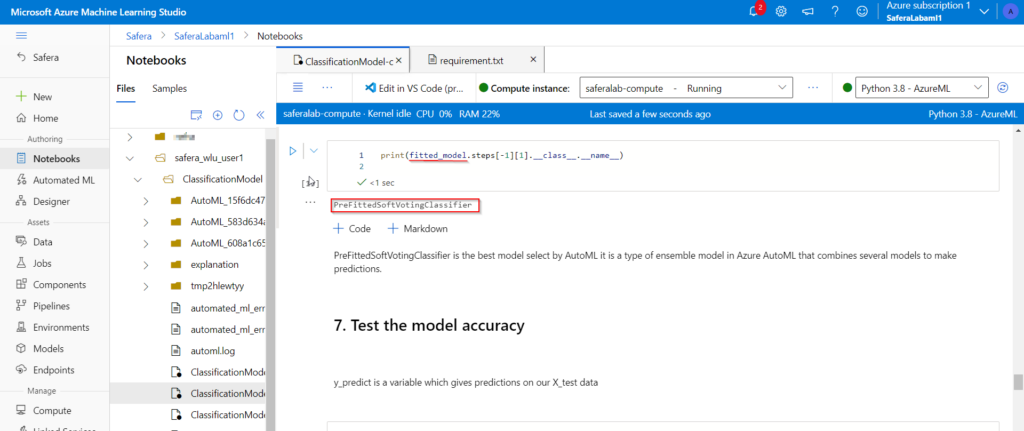
After the model Training completes, we will get our best model with variable name fitted_model.
Model 1: Testing and Evaluation
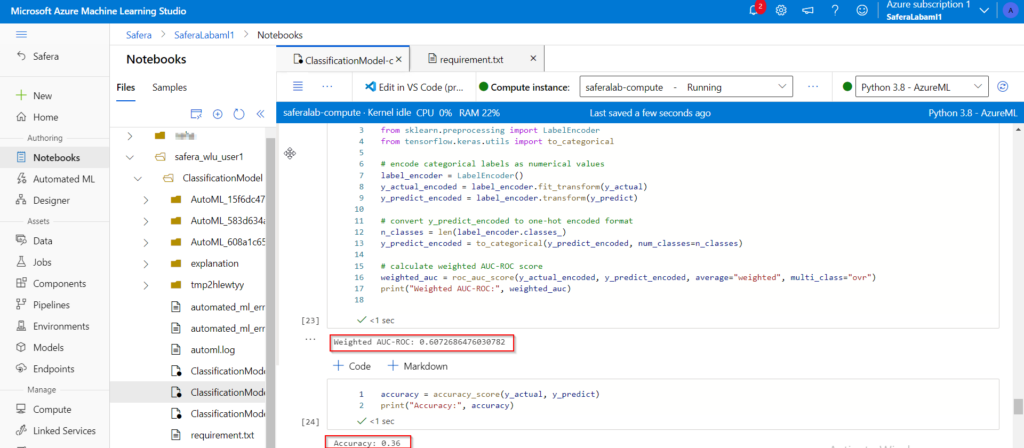
Using the best model i.e. fitted_model, we will do predictions for test data. y_predict is a variable which gives predictions on our X_test data.
We will Evaluate the model Accuracy metrics for the predictions on the test data.
Weighted AUC-ROC & Accuracy are the accuracy metrics used for testing the model here.
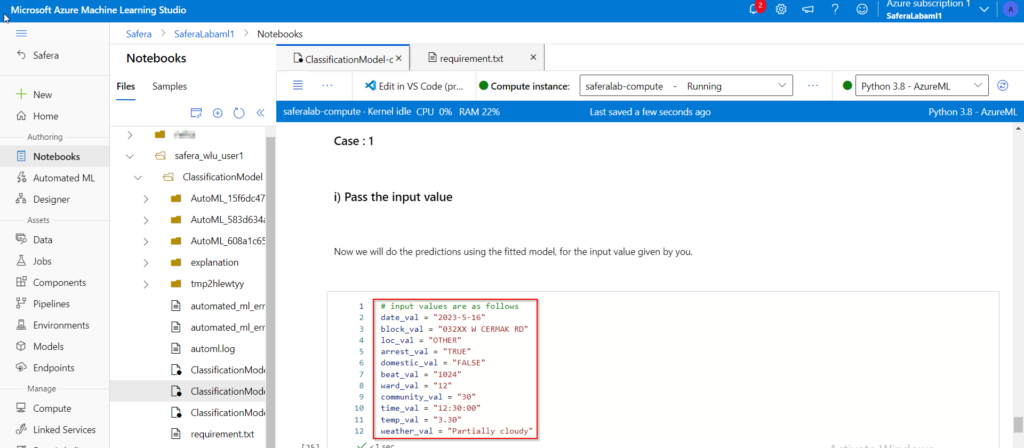
Model 1: Prediction
here we will pass the input values for-
1. Date2. Block 3. Description of the location4. Arrest5. Domestic6. Beat7. Ward8. Community Area9. Time of the Crime10. Average Temperature of the location11. conditions
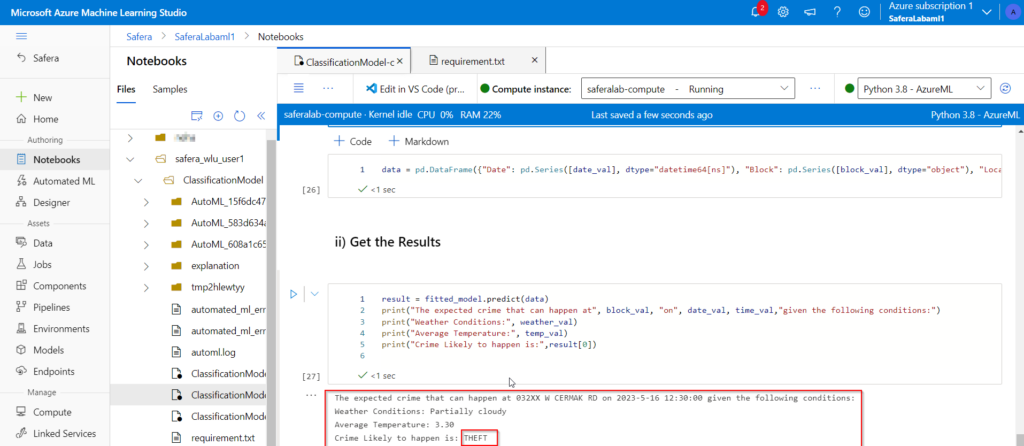
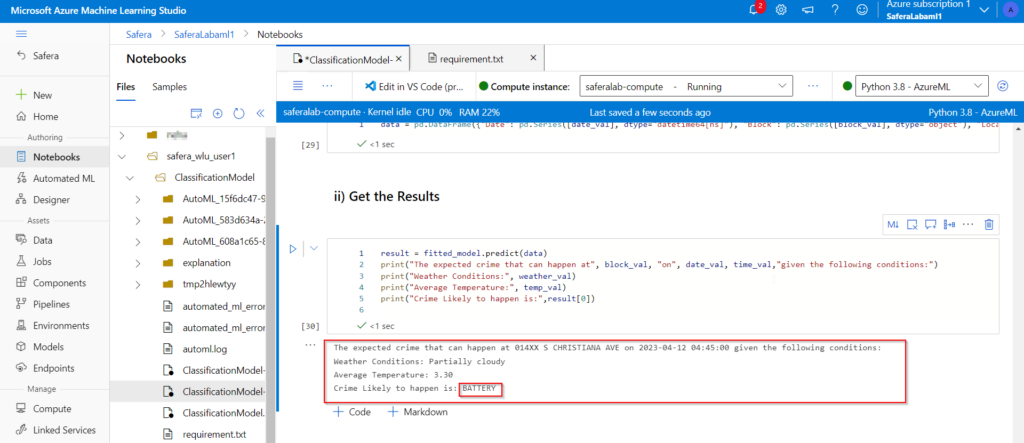
And will do the predictions for
12. Primary Type (Target Column) : Type of crime ex. BATTERY,THEFT,PUBLIC PEACE VIOLATION,ASSAULT etc
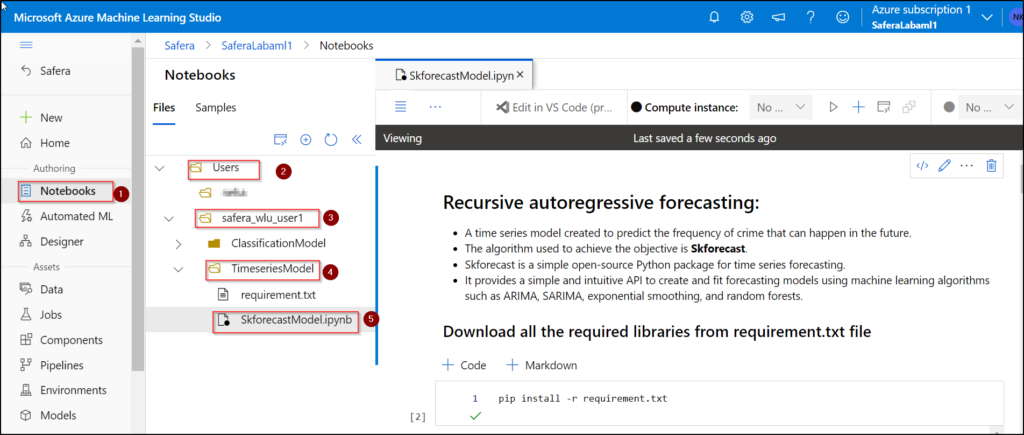
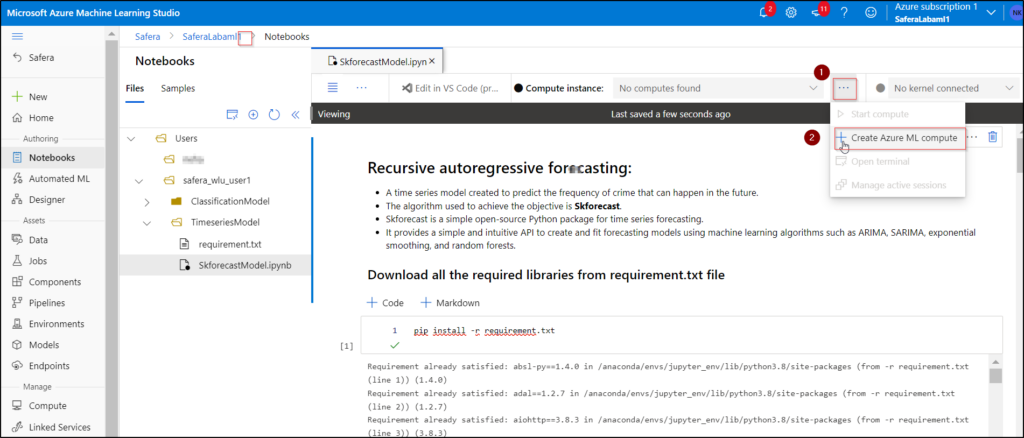
A time series model is created to predict the frequency of crime that can happen in the future. The algorithm used to achieve the objective is Skforecast. Skforecast is a simple open-source Python package for time series forecasting. It provides a simple and intuitive API to create and fit forecasting models using machine learning algorithms such as ARIMA, SARIMA, exponential smoothing, and random forests.
Under the notebook section. Navigate to the “TimeseriesModel” folder inside your user.
Open the “SkforecastModel.ipynb” file.
Note: If the computing machine is already available and created in model 1, then please skip steps 3 and 5.
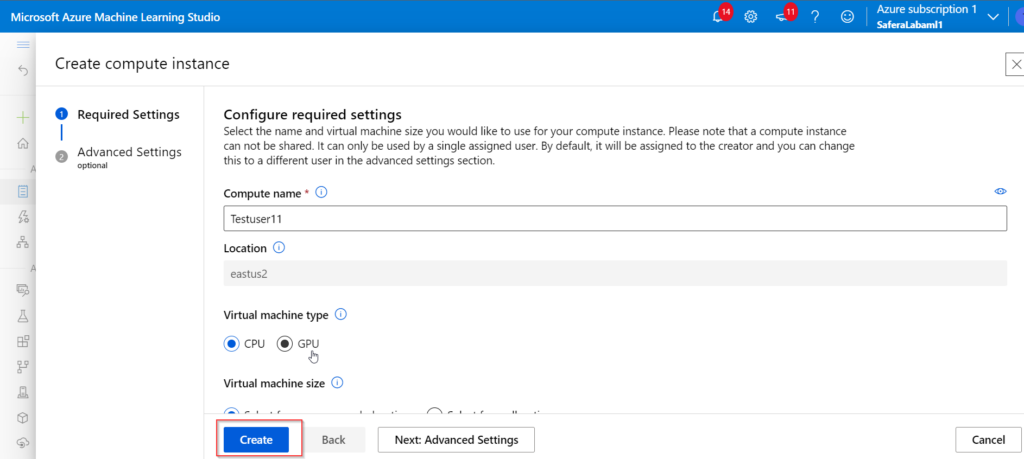
3. Click on the three dots as shown in the screenshot and create a new Azureml compute instance.
4. Click on the Create button
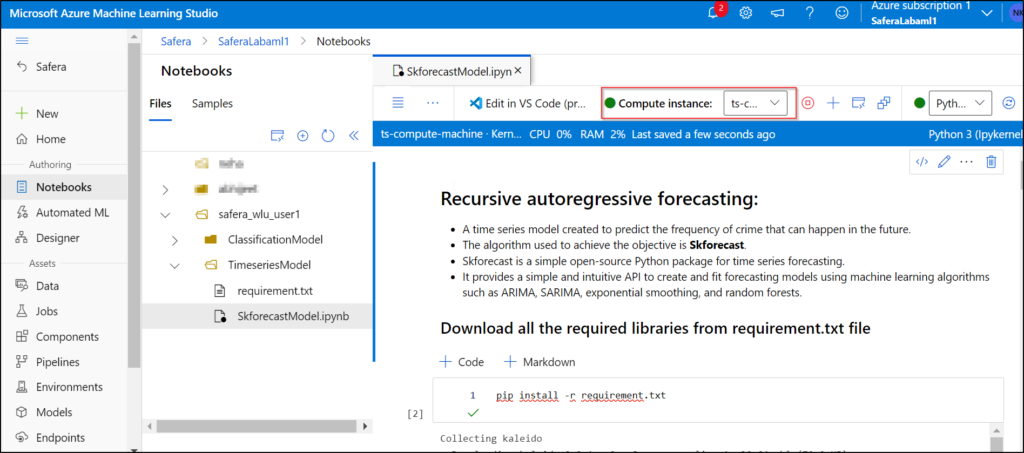
5. You can see a computing instance starting up. Wait till it turns in green colour.
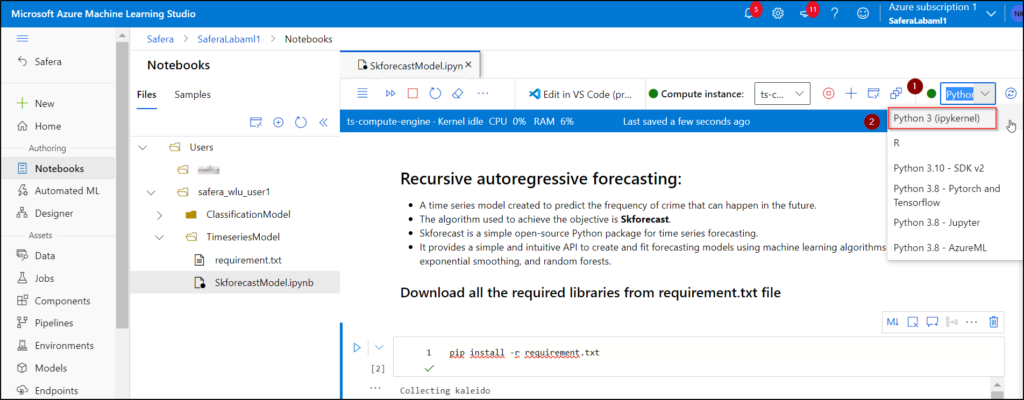
6. Select the kernal as Python 3 (ipykernel) as shown in image.
7. Click on the “Restart kernal and run all cells” button. This will run all the cells in the notebook.
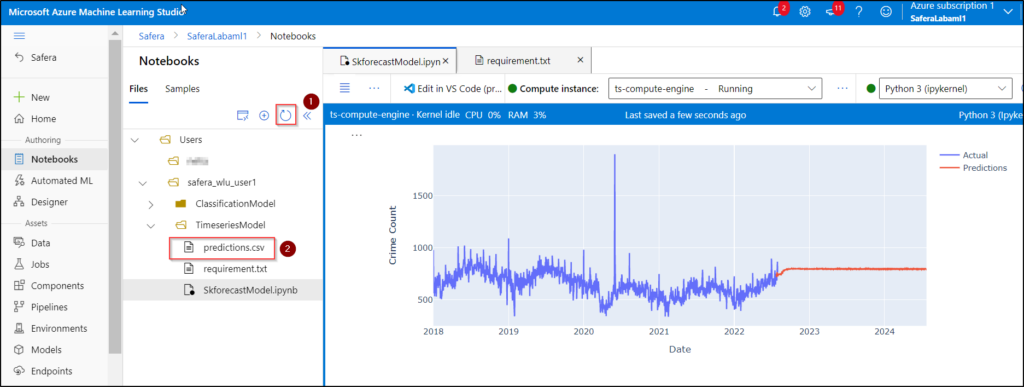
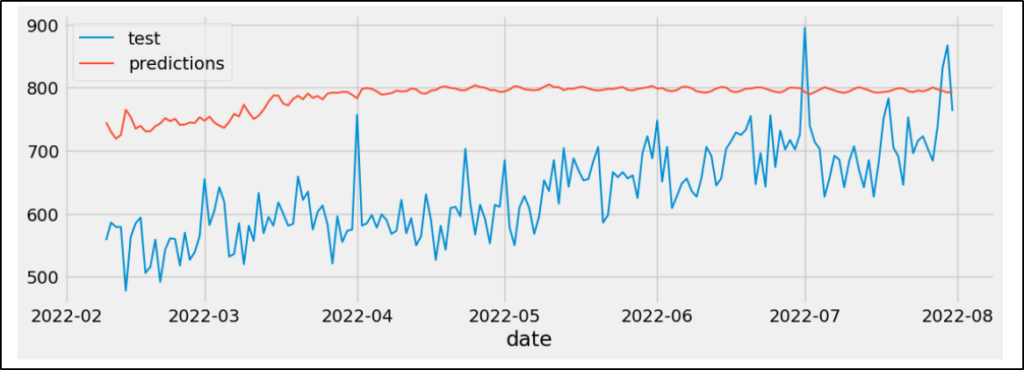
8. This saves the prediction values in a CSV and shows the trend as below:
NOTE: To run the individual cells, please click the cell that you want to run and then press shift+enter (Make sure you run all the cells above that cell as well).
Model 2: Export dataset from SQL Database Connection
Code snippet to establish a SQL database connection and export data from a SQL table.
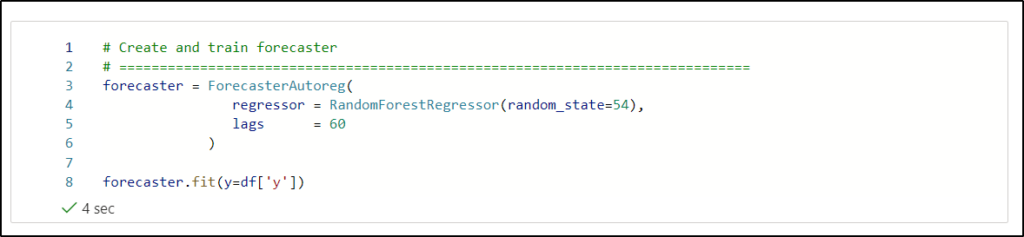
Model 2: Training and Prediction
Model Training:
Test Results:
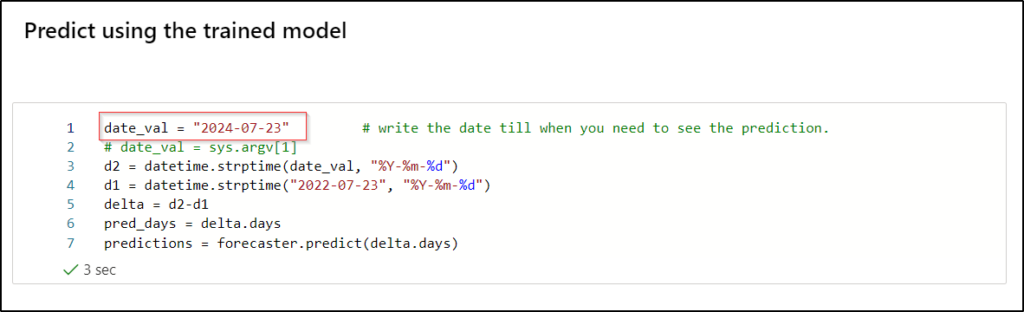
Prediction: Please provide the future date to the date_val variable. The prediction will be saved till the given future date. For instance, in the given screenshot a prediction result is shown for 2 years (from July 23, 2022, to July 23, 2024) as date_val = “2024-07-23”.