Lab 1 – Prepare Your Data
For any kind of data analytics, preparing the data is critically important. As the old adage goes, “Garbage In, Garbage Out”; if the data that’s been fed to the analytical engine is not adequately prepared, none of the resulting analytics will be meaningful.
Therefore, it’s vital to understand the importance of preparing data for analytical purposes; that’s the focus of this Lab.
This lab will help you understand the importance of exploratory data analysis and data preparation. Two types of data sets are provided in the lab: Raw Data sets Raw data lets you understand the kinds of data quality issues that may be encountered in real-world data. Prepared Data sets Prepared data sets are those that have been adjusted so that they’re ready to be used for analytical consumption purposes. Students will be given the exact steps to perform data transformations, cleansing, and other preparatory activities as needed. Students will learn about the available data sets, their schema, and their typical usage. Students will learn how multiple data sets, like Crime and Weather data, can be stitched together to give new insights and predictions.
Table of Content
Frequently Asked Questions
What is Resource Group?
A resource group is a container that holds related resources for an Azure solution. The resource group can include all the resources for the solution, or only those resources that you want to manage as a group. You decide how you want to allocate resources to resource groups based on what makes the most sense for your organization. Generally, add resources that share the same lifecycle to the same resource group so you can easily deploy, update, and delete them as a group.
What is Storage Account?
An Azure storage account contains all of your Azure Storage data objects, including blobs, file shares, queues, tables, and disks. The storage account provides a unique namespace for your Azure Storage data that’s accessible from anywhere in the world over HTTP or HTTPS. Data in your storage account is durable and highly available, secure, and massively scalable.
What is Azure Data Factory?
Azure Data Factory is Azure’s cloud ETL service for scale-out server-less data integration and data transformation. It offers a code-free UI for intuitive authoring and single-pane-of-glass monitoring and management. You can also lift and shift existing SSIS packages to Azure and run them with full compatibility in ADF.
What is Dataflow?
Mapping data flows are visually designed data transformations in Azure Data Factory. Data flows allow data engineers to develop data transformation logic without writing code. The resulting data flows are executed as activities within Azure Data Factory pipelines that use scaled-out Apache Spark clusters. Data flow activities can be operationalized using existing Azure Data Factory scheduling, control, flow, and monitoring capabilities.
What is Linked Service?
Linked services are much like connection strings, which define the connection information needed for the service to connect to external resources. Think of it this way; the dataset represents the structure of the data within the linked data stores, and the linked service defines the connection to the data source. For example, an Azure Storage linked service links a storage account to the service. An Azure Blob dataset represents the blob container and the folder within that Azure Storage account that contains the input blobs to be processed.
How to undo any steps?
Like other tools you can use all windows shortcuts in Azure portal hence can use CTRL+Z for Undo
What is Dataflow Debug mode?
Azure Data Factory and Synapse Analytics mapping data flow’s debug mode allows you to interactively watch the data shape transform while you build and debug your data flows. The debug session can be used both in Data Flow design sessions as well as during pipeline debug execution of data flows.
Objectives
This lab will help you understand the importance of exploratory data analysis (EDA) and the types of data preparation that are required for downstream analytical consumption.
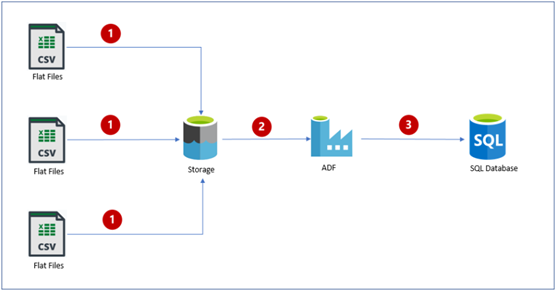
The basic flow diagram for this lab is outlined below; it shows all of the activities we will be performing as part of the lab, starting with uploading input csv files into Azure BLOB storage and then using Azure Data Factory to perform some basic transformation and merge operations on the input dataset. Finally we will insert the output data into an Azure SQL database.
Introduction to Datasets
Here we will be using two datasets in CSV (Comma Separated Value) format:
CrimeData.csv
This dataset contains crime data from Chicago, Illinois. It has been extracted from the city portal, and contains crime-related data between 2018-01-01 and 2023-02-08.
Each column description for this dataset has been outlined below.
|
Column Name |
Column Description |
| ID | The unique ID for each crime |
| Case Number | The official case number associated with the Crime |
| Date | Date of Crime |
| Block | Block number where the Crime has happened |
| IUCR | Illinois Uniform Crime Reporting is a four digit code that law enforcement agencies use to classify criminal incidents when taking individual reports |
| Primary Type | High level Category of Crime |
| Description | Brief description related to the Crime |
| Location Description | Brief description related to location of Crime |
| Arrest | To denote whether an arrest has occurred in relation to the crime |
| Domestic | To denote whether the crime is considered a domestic crime or a public one |
| Beat | Beat number of location |
| District | District number where the crime occurred |
| Ward | Ward number where the crime occurred |
| Community Area | Community Area code where the crime occurred |
| Year | Year of the crime |
| Updated On | The date when the entry was last updated |
| Latitude | Lat coordinates of the crime scene |
| Longitude | Long coordinates of the crime scene |
| Location | Combination of Lat and Long coordinates giving the precise location |
WeatherData.csv
The second dataset contains daily weather data from Chicago between 01-01-2018 and 15-02-2023. This data has been extracted from a website called VisualCrossing, where we can select any city/place and a date range to get daily weather data in csv format.
Each column description for this dataset has been outlined below.
| Column Name | Column Description |
| name | Name of City |
| datetime | Date for which the weather data has been recorded |
| tempmax | Maxmimun temperature for that day |
| tempmin | Minimum temperature for that day |
| temp | Temperature at the time of recording the data for that day |
| conditions | Climatic condition for the day |
| description | Overall weather description for the day |
Dataset Download Instruction
Click on the above links to download both of these required input CSV files.
Task-1:- Setup Input file storage in Azure
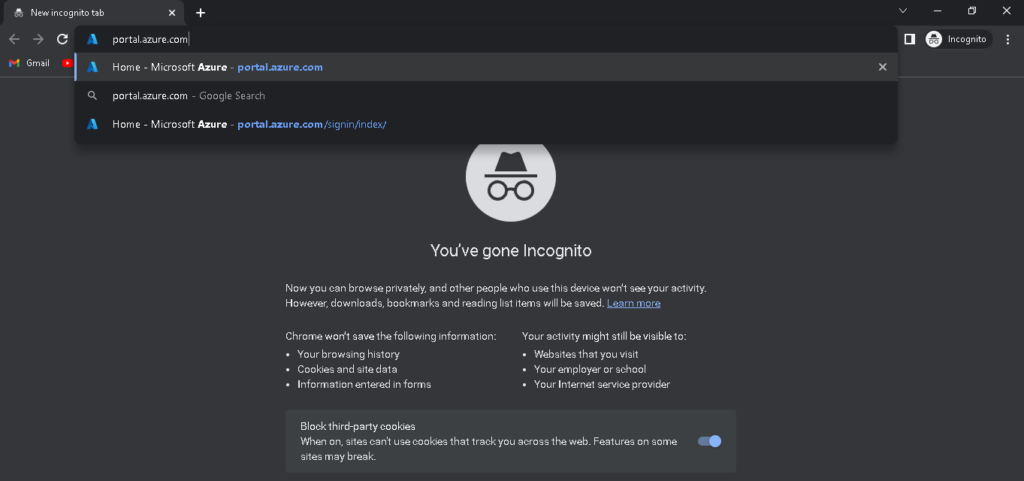
1. Copy the given URL for Azure Portal and open it in an incognito window of your browser.
2.A. Enter your User Name provided by the facilitator for signing into Azure the portal
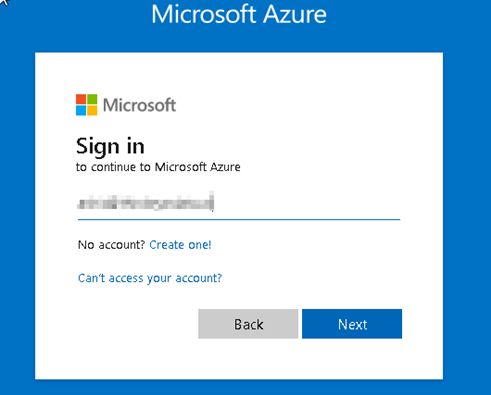
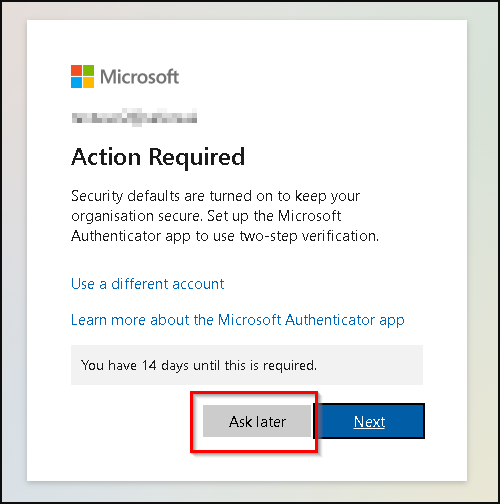
Click on Ask Later in case you see below pop up.

2.B. Then enter the password provided for the lab.
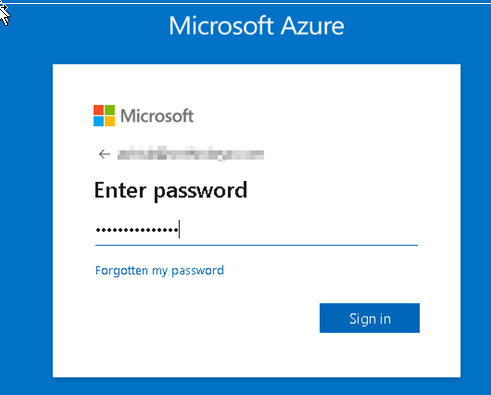
Click on Yes if you get below pop up asking to stay signed in.(Ignore if this doesn’t appear)
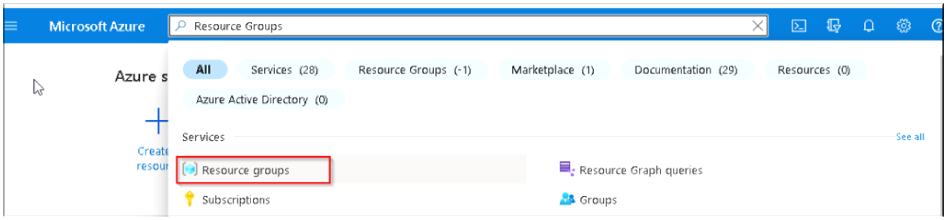
- Once Logged In into the portal use the global search option type- Resource Group.
Click on the highlighted service.
Note- A resource group is a container that holds related resources for an Azure solution. The resource group can include all the resources for the solution, or only those resources that you want to manage as a group.
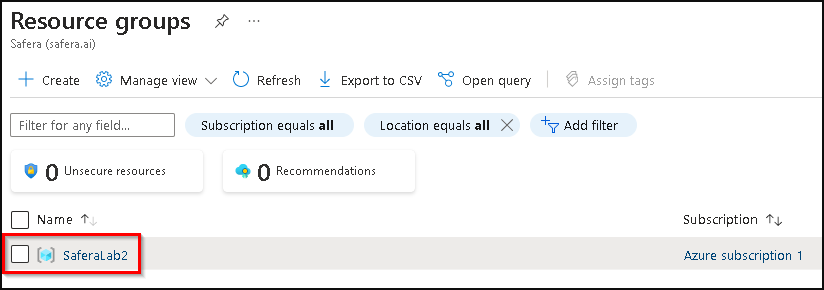
- Inside Resource groups (RG) services you will find list of available RGs, so search for SaferaLab and Click on the corresponding resource group.
Note- The exact name might differ from the given snip below, like it might be SaferaLab1/2/3.. etc, so please select whichever assigned resource group visible to you based on your user number for the lab
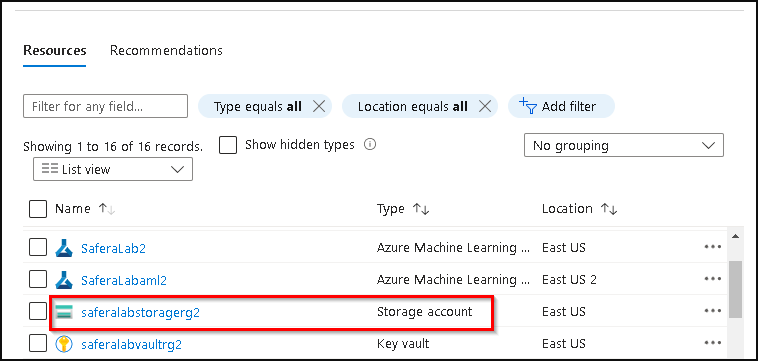
- Click on Storage Account named saferastoragerg (Here to expedite the lab we have already created the given storage account for you)
Note- An Azure storage account contains all of your Azure Storage data objects, including blobs, file shares, queues, tables, and disks. The storage account provides a unique namespace for your Azure Storage data that’s accessible from anywhere in the world over HTTP or HTTPS.
Note- The exact name might differ from the given snip below, like it might be saferastoragerg1/2/3.. etc, so please select whichever assigned storage account visible to you based on your user number for the lab
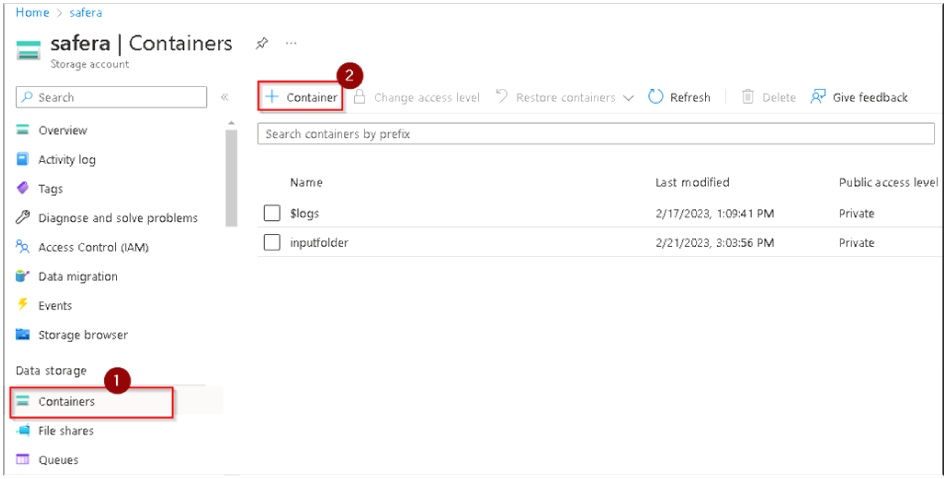
6. Click on Containers under Data Storage in the far left column and then Click on + button to create a new container to store our input files.
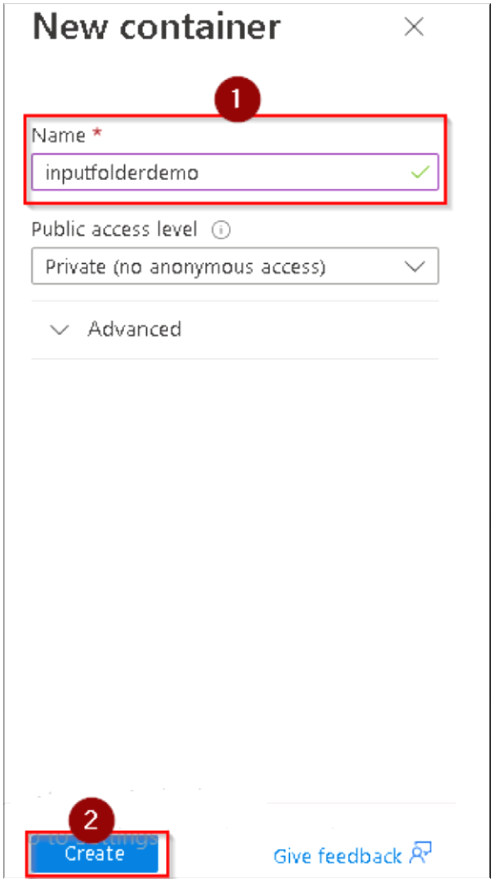
7. A popup window will appear at the right side asking for Container name. You’ll need to create a unique name, so use a variation of inputfolderdemo with a number at the end (all in lower case) and then Click on Create.
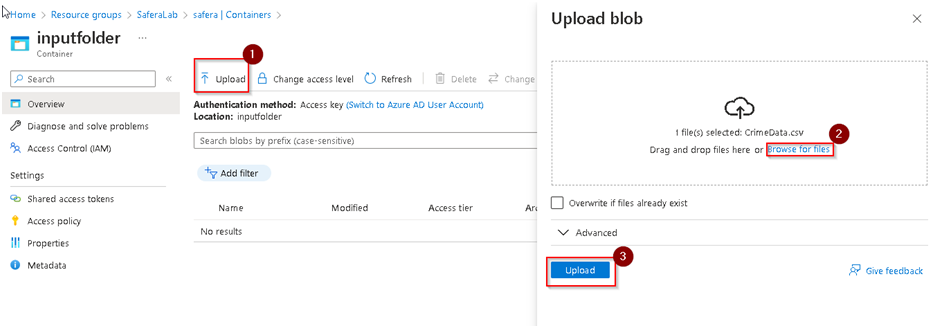
8. Once the new container is created, Click on it to open it and upload both of the input csv files which we downloaded earlier.
Click on the Upload option and then browse to the required files which you downloaded.
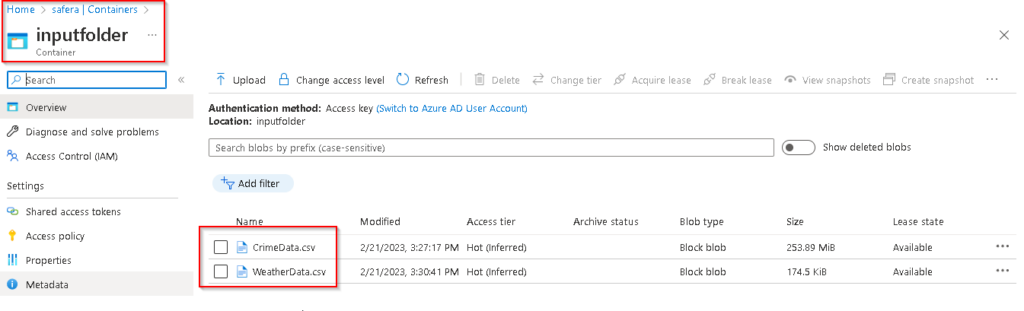
If we Click on Upload it will start the uploading process. In order to save time we’ve already uploaded the required input files to the container named inputfolder as shown below. We’ll be using that folder in this lab going forward.
In order to save time we have already uploaded the required input files to the container named inputfolder as shown below. We’ll be using that folder in this lab going forward.
Task-2: Data Cleansing & Transformation using Azure Data Factory
Azure Data Factory is Azure’s cloud ETL (Extract Transform Load) service for scale-out serverless data integration and data transformation. It offers a code-free UI for intuitive authoring and single-pane-of-glass monitoring and management.
We will be using the data factory for this task with these steps:
-
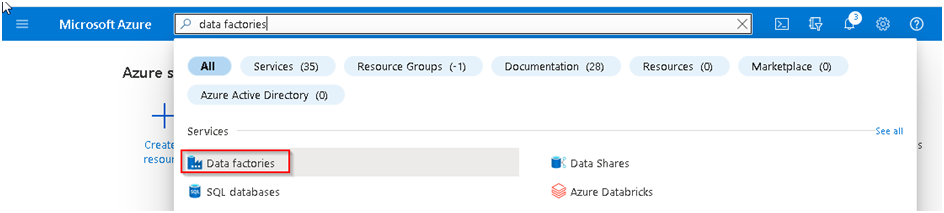
Click Home in Azure to go back to the main page. Then search for Data Factories in the top search bar and click on the highlighted option.
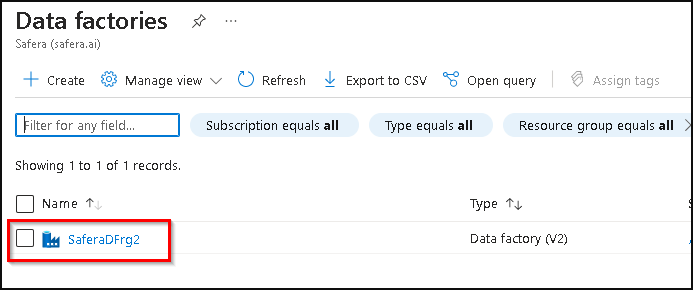
2. Select saferaDFrg.
Note- The exact name might differ from the given snip below, like it might be saferaDFrg1/2/3.. etc, so please select whichever assigned data factory visible to you based on your user number for the lab.
Click on Launch Studio
Note- The actual name of data factory showing in your lab might differ, so select the available data factory with a similar name.
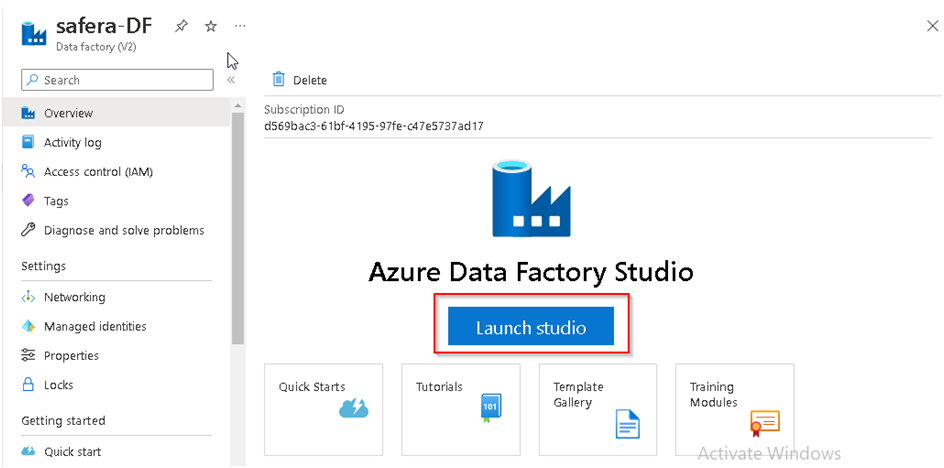
3. This will launch the Azure Data Factory studio in a new tab where we can develop the required pipelines/dataflows.
Click on Ask Later in case you see below pop up.
Click on Yes if you get below pop up asking to stay signed in.

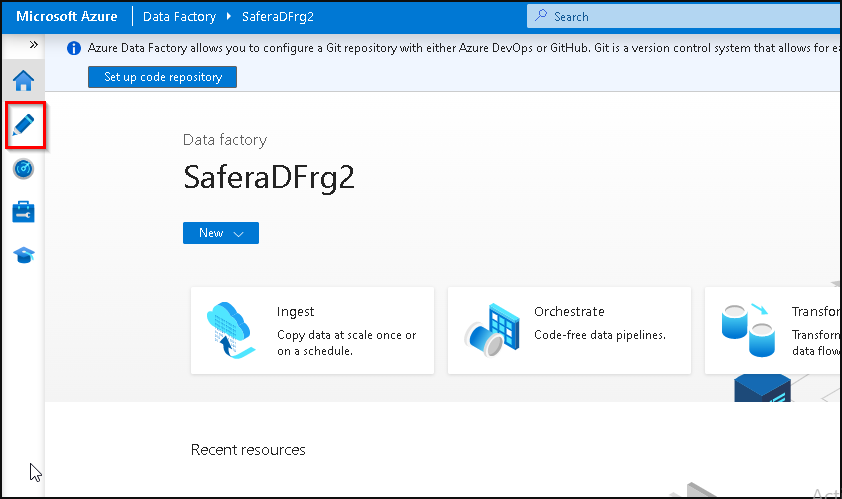
Once Studio is opened then Click on the Author option to begin the development.
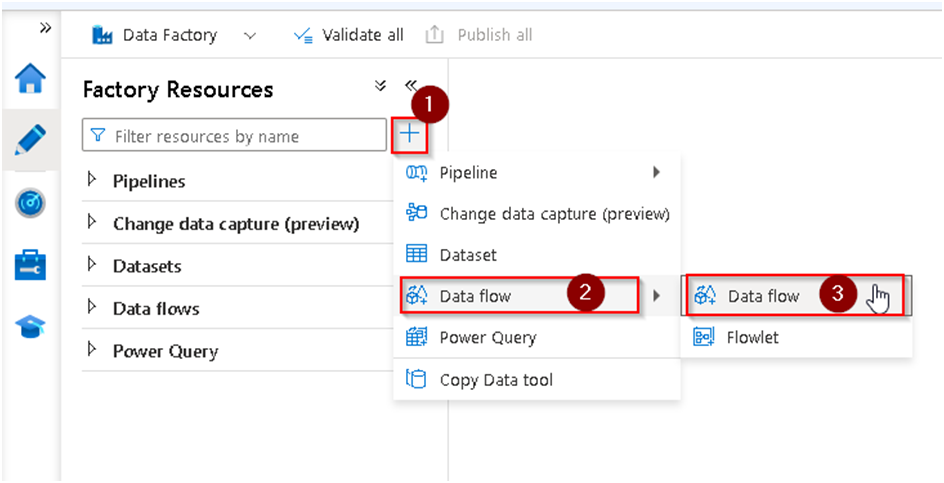
4. Click on the + icon to create a new component and then select Dataflow.
Note: Data flows are visually designed data transformations in Azure Data Factory. Data flows allow data engineers to develop data transformation logic without writing code. The resulting data flows are executed as activities within Azure Data Factory pipelines that use scaled-out Apache Spark clusters
5. It will open the Dataflow designer window.
On the right hand enter the dataflow name and description (optional).
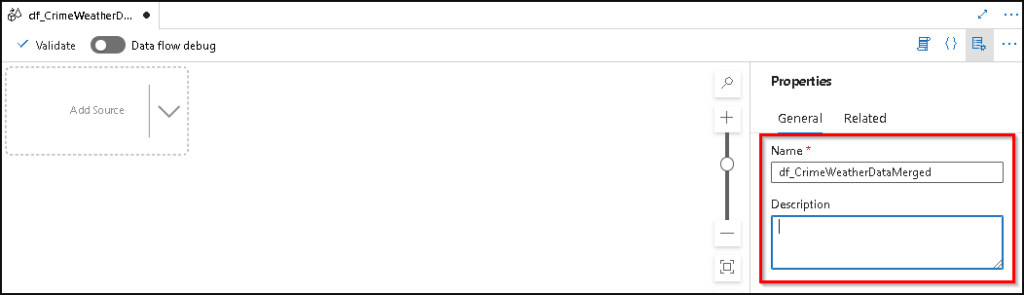
Click on add source option.
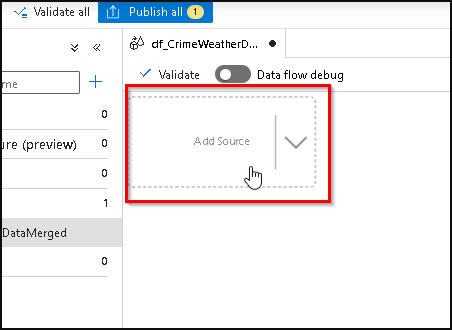
- You will see source setting with several options, so we will first rename the output stream to CrimeDataInput as per our requirement.
Click on the + option to add the required data source for it keeping other options under the Source Setting section unchanged.
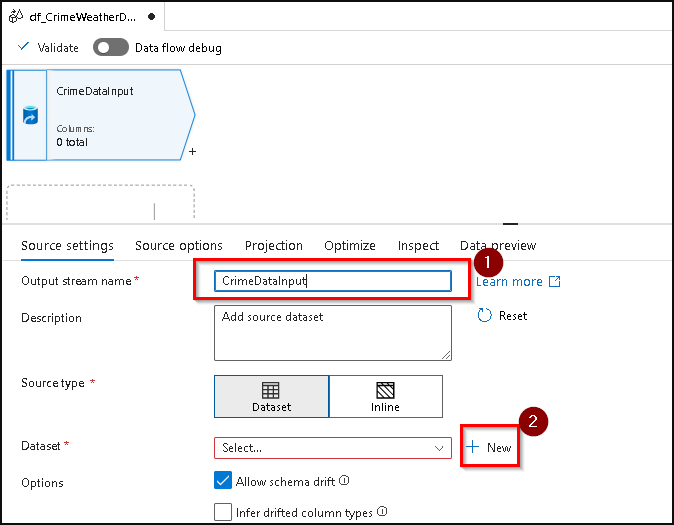
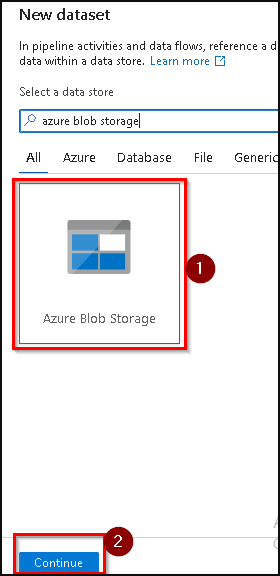
- A dialog box will appear on the right hand side; search for Azure blob storage.
Select the icon and then Continue, this is to access our source files which we have placed in our storage containers
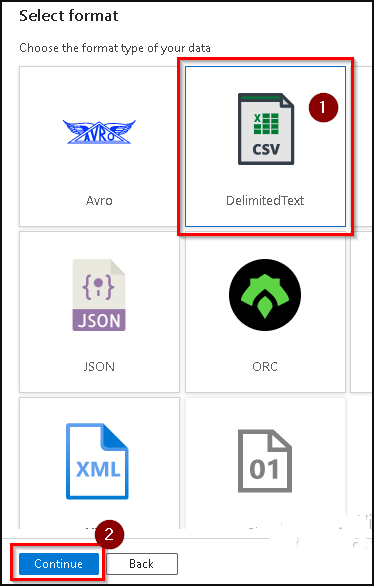
Select the file format as Delimited (CSV) and then Continue.
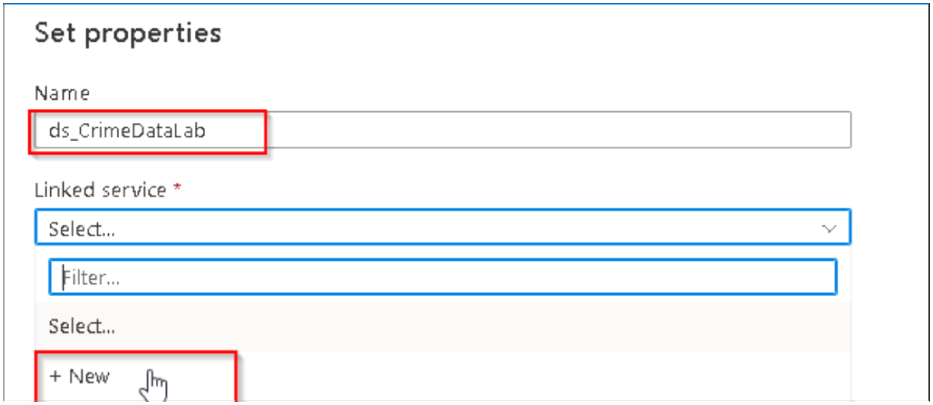
- Under the Dataset property section rename the dataset as ds_CrimeDataLab.
Under the Linked services section select New to create a new Linked service connection with our storage account which have the blob containers.
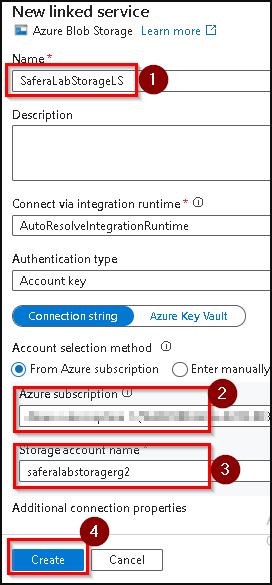
- Then the Linked Service Creation dialog box will appear and here also we have to rename the service as SaferaLabStorageLS per our requirement.
Keep the other options unchanged and then scroll down to Select the available Azure subscription from the drop down.
Select the Storage account named SaferaLabStoragerg_ which is available for you in the drop down.
Note- The exact name might differ for the last character; it may be SaferaLabStoragerg1/2/3 and so on, so please select the available storage based on your user number
Click on Create at the bottom.
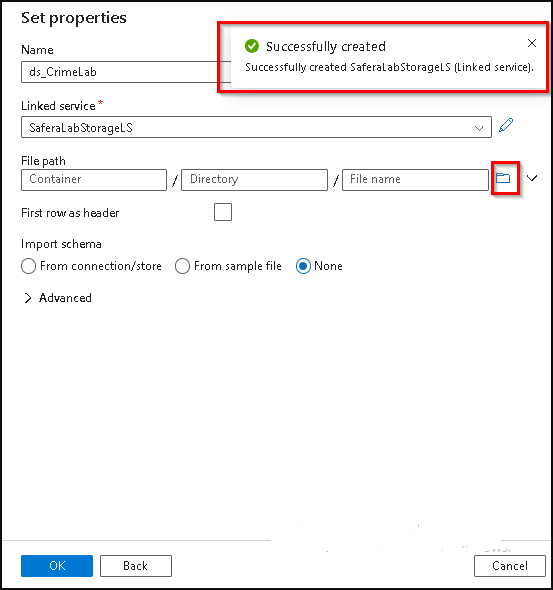
10. Upon successful creation of the linked service, you will be redirected back to the dataset property window where you can see the newly created Linked service already selected with the success message pop up.
Now we can browse our input files by clicking on the icon below
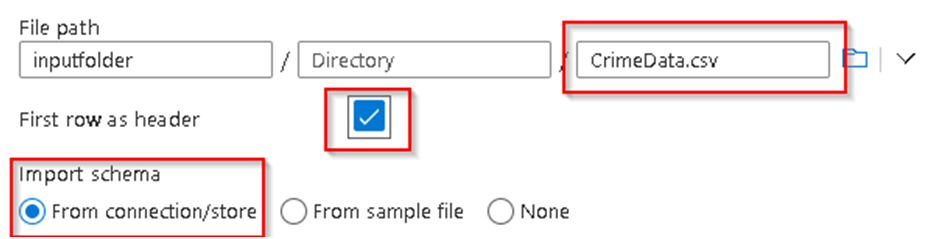
11. Browse to our Container named InputFolder which we created at the beginning and Click on it.
Select the CrimeData.csv file from it.
You’ll see the file name appearing in the given section. Make sure to check the two options for header row and import schema as per below.
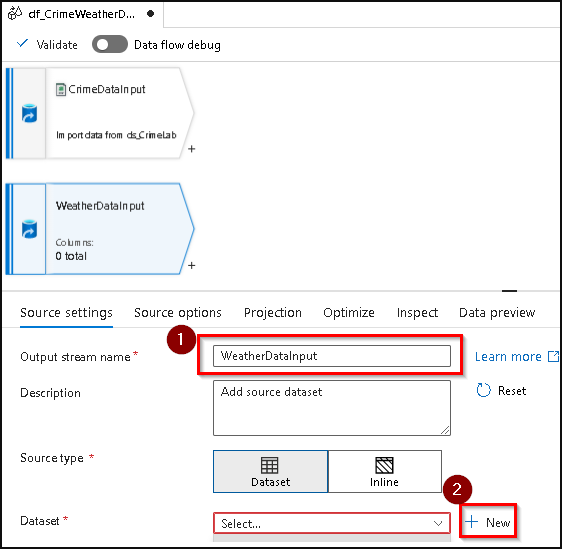
12. So this completes the source addition for Crime Data. Similarly we will add another source by clicking on the Add Source section for Weather Data .
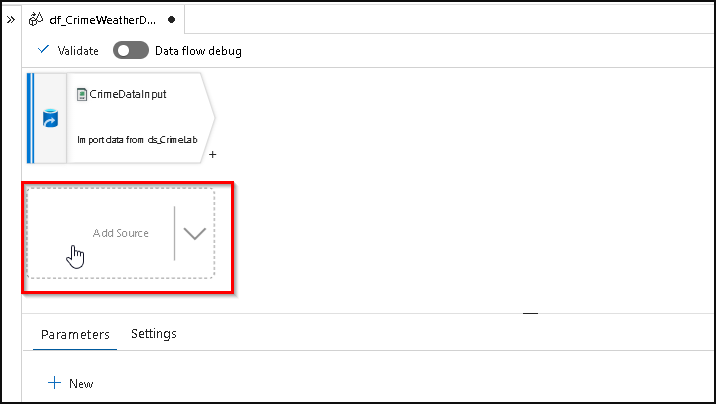
13. We have to follow a series of similar steps to the ones we did above, like renaming the stream as “WeatherDataInput”.
Under the Dataset section Click on New
Similarly, search for Azure Blob Storage, select it and continue–>Delimited(csv) –> Continue.
But this time there is no need to create new Linked Service to the Storage Account since we did this previously.
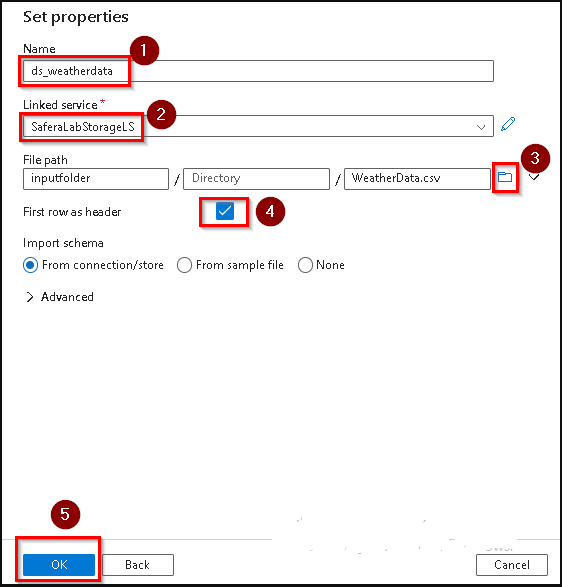
So for now we will just rename the dataset to WeatherDataInput.
Select the Linked service named SaferaLabStorageLS which we have created previously.
Similarly browse to the weather file from the container named input folder and Click OK.
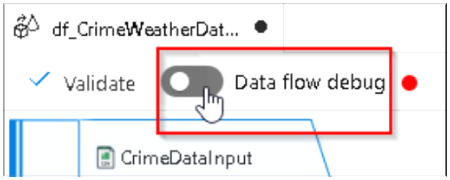
14. Now we have both of our source systems configured, so we can analyse the datasets under Preview options, so first we will enable the Data flow debug mode.
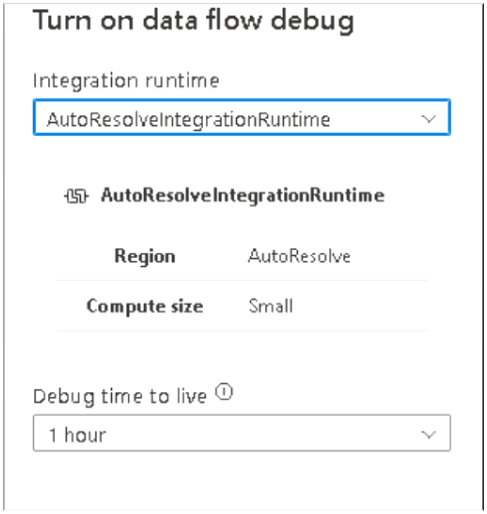
15. Upon Clicking a dialog box will appear as per below, so keep all the options unchanged and Click OK, this will fire up a Spark cluster at the backend for 1 hour and within this period we can Preview the top 1000 records (default) at any given stage of transformation as the cluster will implement the transformations in the background and show us the possible result set, so using this we can easily cross check if the code is generating the desired output.
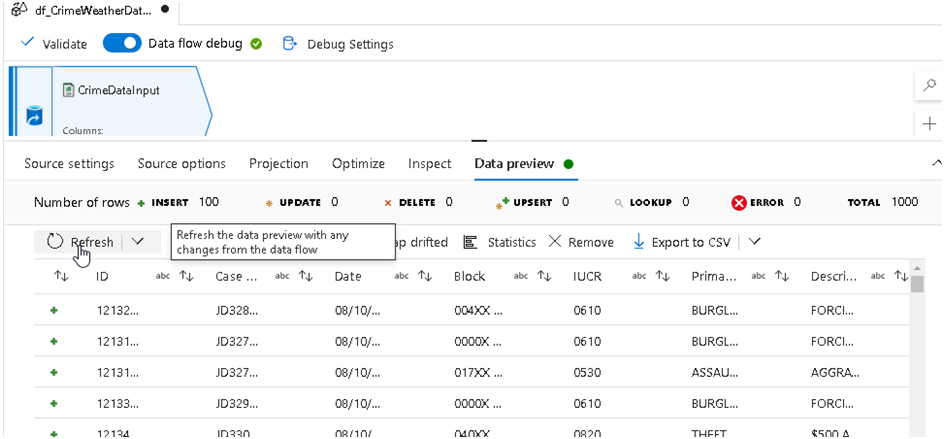
- Once the Debug option gets activated, then Select either of the data sources, Crime or Weather.
By clicking on it and below we will get a Preview tab where we can Click Refresh to get the sample dataset from the file. You may need to click on the three horizontal dots beside Optimize to see the Data preview option.
17. Similarly we can select the Weather Dataset and analyse the sample data.
18. Now we can proceed with some of the basic transformations which we are going to use in this Lab, like Derived Column. As the name suggests, this transformation is used to change or derive existing or new columns respectively based on input columns from the dataset. So in this example, as you can see below, we have a Date field in the Crime data which has both date and time value recorded in it.
19. We can implement a couple of derived columns to find out the day, month, year, and time out of this available value.
20. Click on the + icon just under the CrimeInput source and Search for Derived Column and click on it.
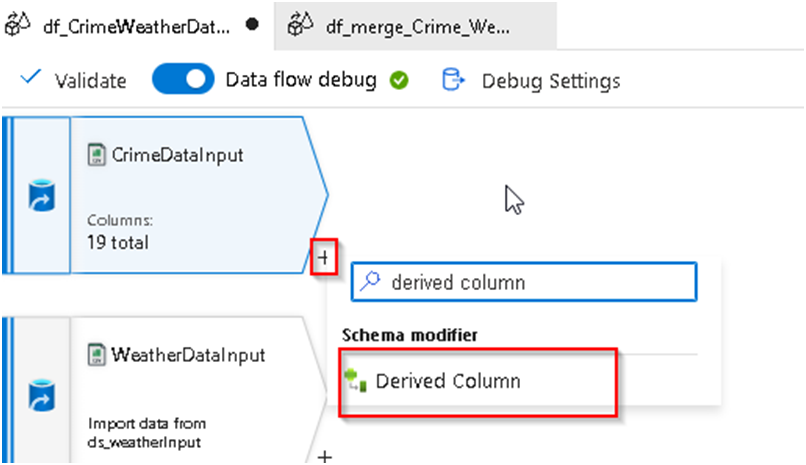
21. Upon clicking it will add the a Derived Column transformation into the dataflow.
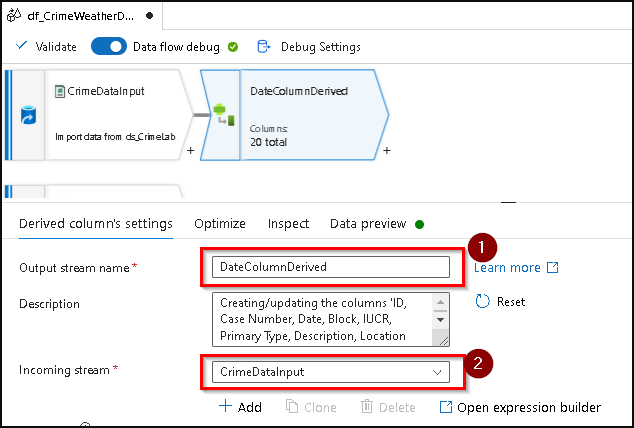
Will do the basic operation of renaming the output stream for it to DateColumnDerived.
Ensure that the input stream points to the CrimeDataInput
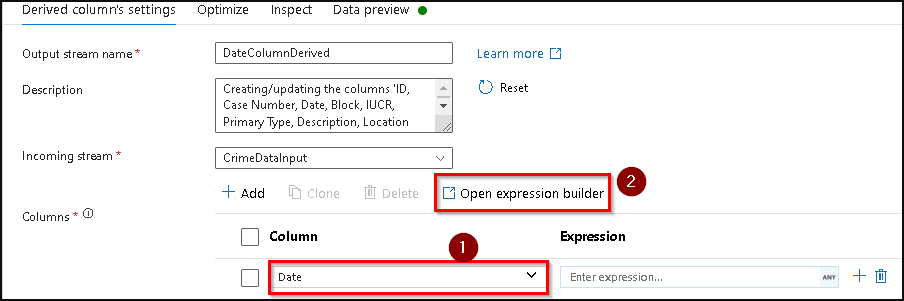
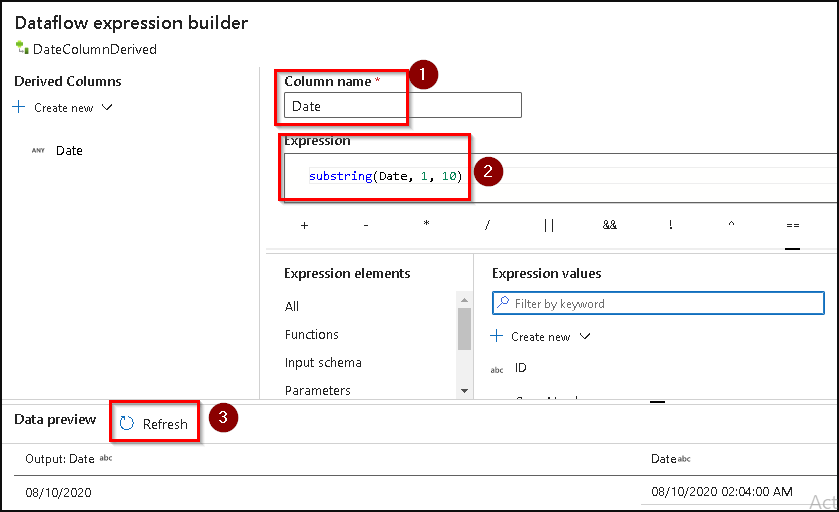
22. Next under Columns section, select the Date column from the input as we will be using it to extract the Date part out of it and for its expression section.
Click on the Open Expression builder option.
23. This will open the expression builder window where we will configure the background transformation logic.
We will be using a substring to extract part of the date out of the available datetime value using the expression from the below table for Date column.
We can do a data preview as well to ensure that the transformation is happening as expected.
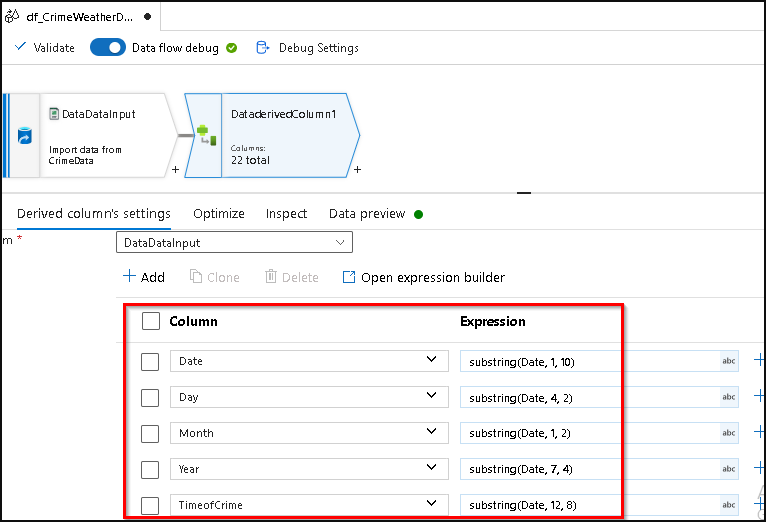
- Similarly we can also create new columns like extracting the day, month, year, Timeof Crime, etc.
Click on Create New option at the left side.
Click on Column.
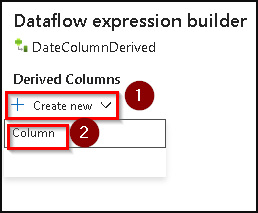
Rename the Column name and update the expression using the values from the table below and similarly add the other columns as well.
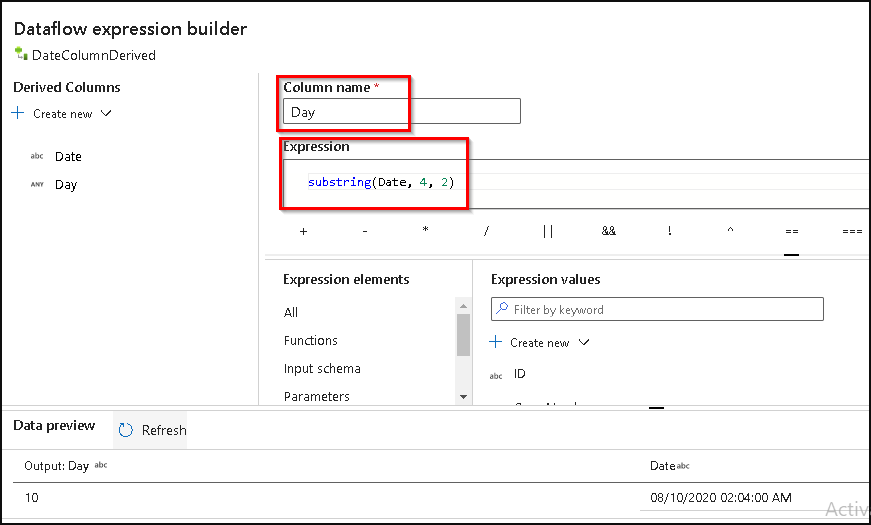
Here are the expressions so that you can add them more easily:
| Column | Expression |
|---|---|
| Date | substring(Date, 1, 10) |
| Day | substring(Date, 4, 2) |
| Month | substring(Date, 1, 2) |
| Year | substring(Date, 7, 4) |
| Time of Crime | substring(Date, 12, 8) |
Once you have added all the columns click on Save and Finish
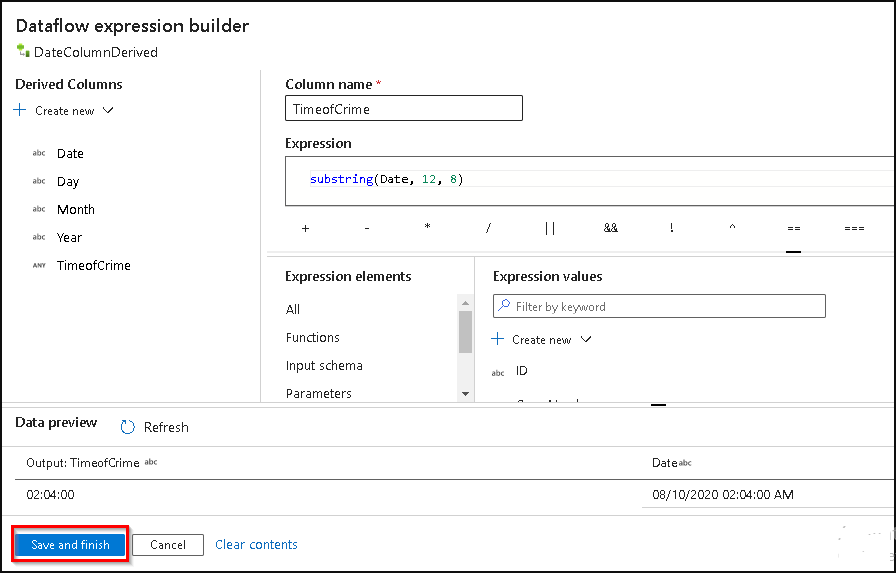
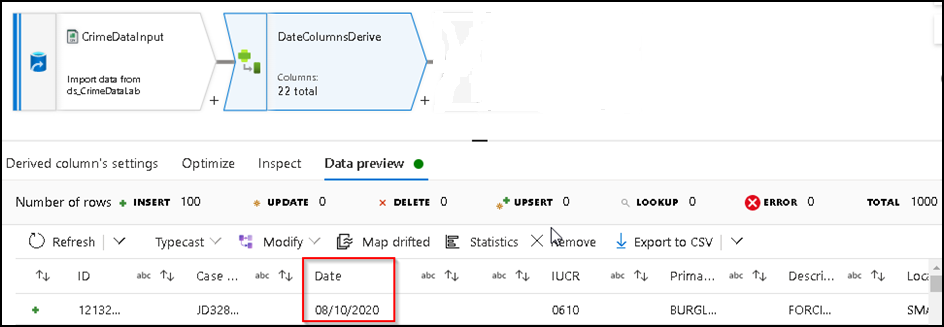
The Derived Column transformation will now show all the required columns you have just added as shown below.
25. Since our main objective is to merge Crime & Weather data, we can now Preview the Weather data to see if can find any related attributes between both datasets that we can use to perform a join operation.
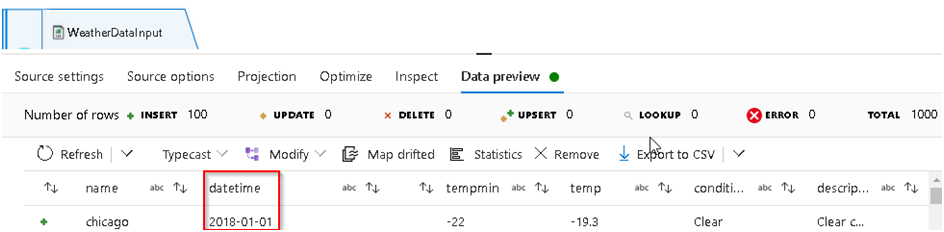
26. So we can see that the Weather data has a Date field highlighted above which we can join with the corresponding Date field of the Crime data to merge both of them based on that, but the Weather data date format is YYYY-MM-DD and our Crime data date format is DD/MM/YYYY, so we’ll have to convert the latter to the YYYY-MM-DD format to match the Weather dataset.
- As required we will use another Derived column transformation for this.
Click on the + icon available against the DateColumnDerived transformation which we have already added.
Search for derived column and add another derived column into the flow.
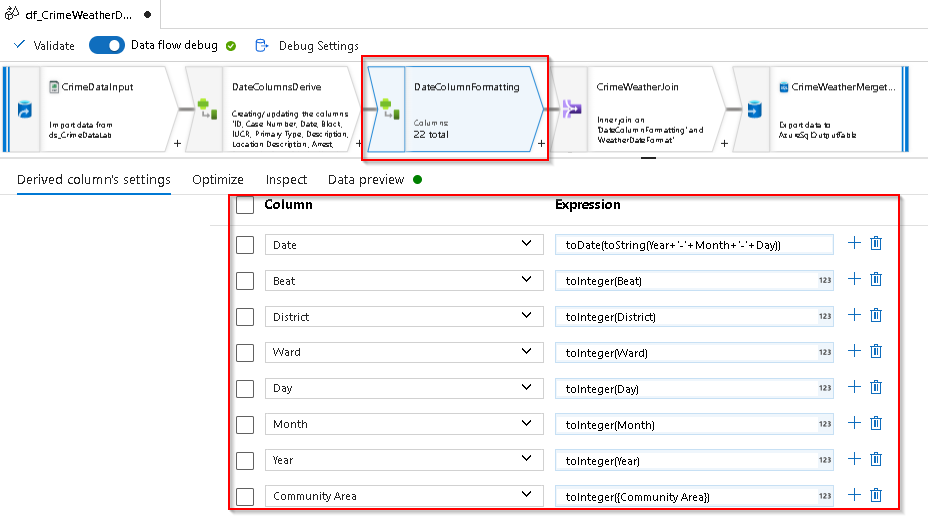
Rename it as DateColumnFormatting
Inside it we will use the Day, Month, Year column which we have derived at step-24 for Crime data to build the required Date format and we can also convert the datatype of numeric columns as per below.
Here are the expressions so that you can add them more easily:
| Column | Expression |
|---|---|
| Date | toDate(toString(Year+’-‘+Month+’-‘+Day)) |
| Beat | toInteger(Beat) |
| District | toInteger(District) |
| Ward | toInteger(Ward) |
| Day | toInteger(Day) |
| Month | toInteger(Month) |
| Year | toInteger(Year) |
| Community Area | toInteger({Community Area}) |
28. Now we have to transform the formatting of the date column in the Weather dataset into the required date format and the temperature related columns are to be converted into decimal format.
Add similar derived column transformation against Weather Data output stream and rename it as WeatherDataFormat
Configure it using the expression builder as you have done earlier and convert the datatype of the columns using the below expressions.
| Column | Expression |
|---|---|
| datetime | toDate(datetime) |
| tempmax | toDecimal(tempmax) |
| tempmin | toDecimal(tempmin) |
| temp | toDecimal(temp) |
- Now we can use the join transformation to merge both datasets.
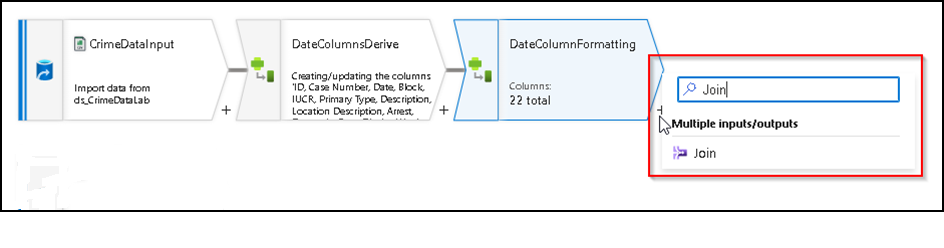
So similarly we can Click on + icon against DateColumnFormatting transformation which we have added above.
Search for Join and select the Join option.
30. A join transformation will be added to the flow and similarly under the Join setting we can edit the output stream name, select the left and right source.
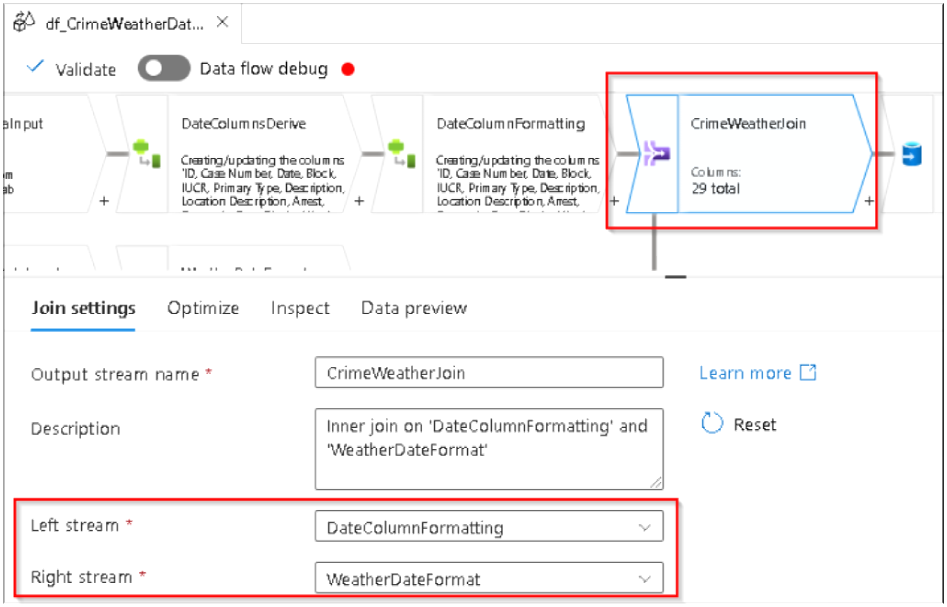
Select the join type & join based on which column, etc. All these details need to be updated here, so we have to configure it as below. Note- Join is used to combine data or rows from two or more dataset based on a common field between them.
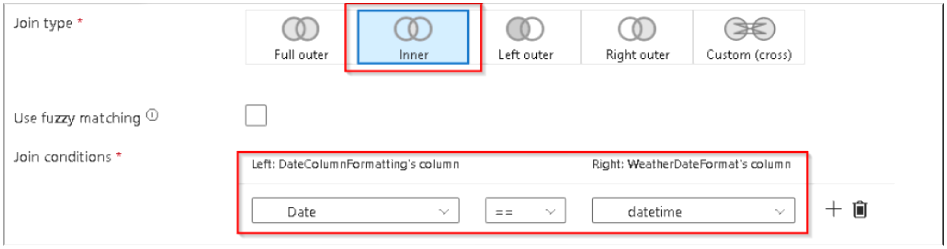
31. Here we will do an inner join between two dataset using the date columns for it as shown above.
Note: The INNER JOIN selects all rows from both the datasets as long as the condition is satisfied.
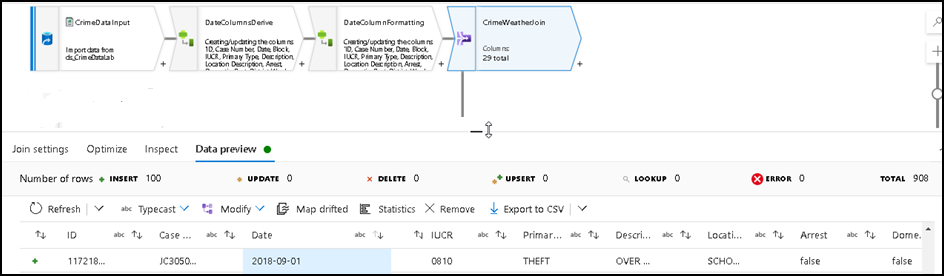
32. Under the Data Preview section we can see whether the join is happening properly or not.
33. Once we’re satisfied with the result set we can write the final merged dataset into one SQL table which is to be used in subsequent Labs as a source for Visualization & AutoML operations.
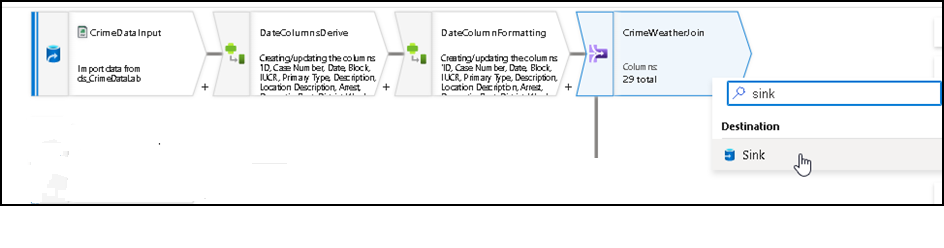
So we will go ahead and add a Sink into the flow by Clicking on the + icon after Join
Search for Sink and add the object into the flow as below.
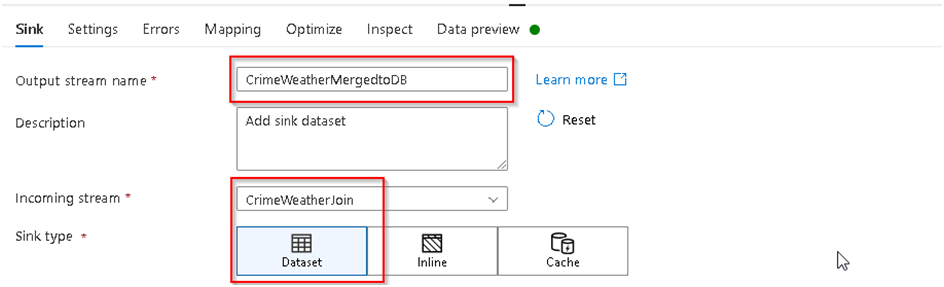
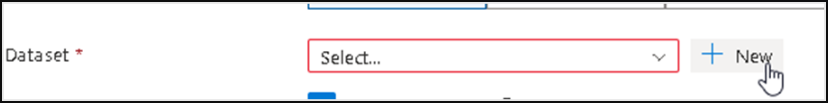
- Under Sink setting rename the output stream and configure the Join output dataset as the input stream to Sink and under Dataset section.
Click on New as we have to create a new Linked service for the Azure SQL server connection and selecting our Target table from it like we did in Task 1 where we created a linked service to a storage accounts to access our input files.
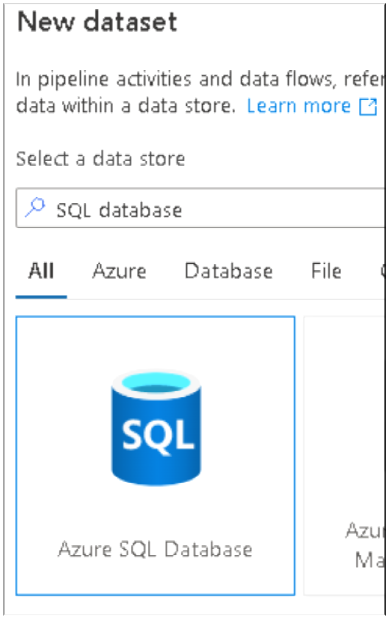
35. Search for SQL database, select it and Click Continue
36. Set the Dataset name and under Linked services Click on New
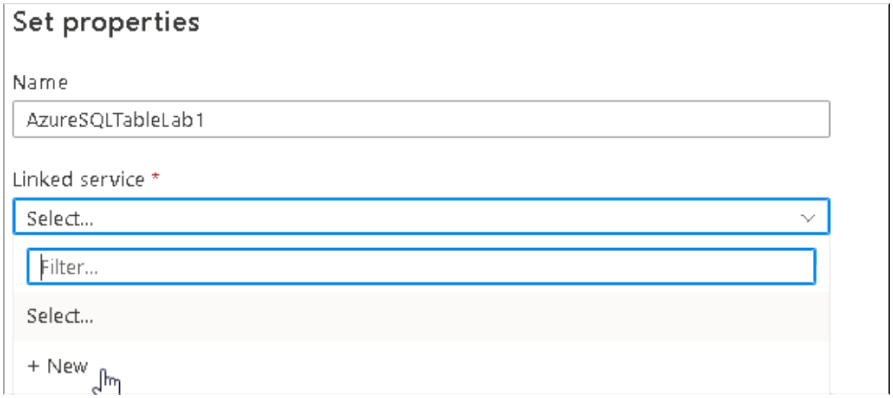
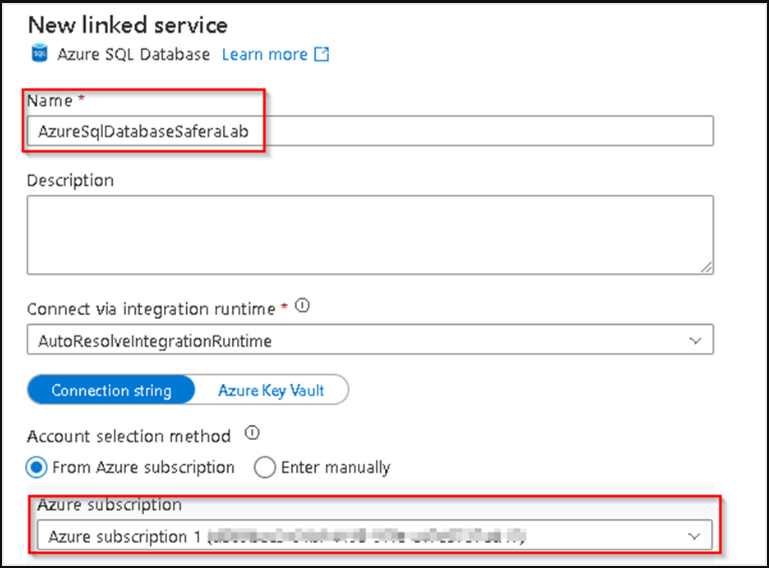
37. Rename the Linked Service as AzureSqlDatabaseSaferaLab.
Select the available subscription from the drop down.
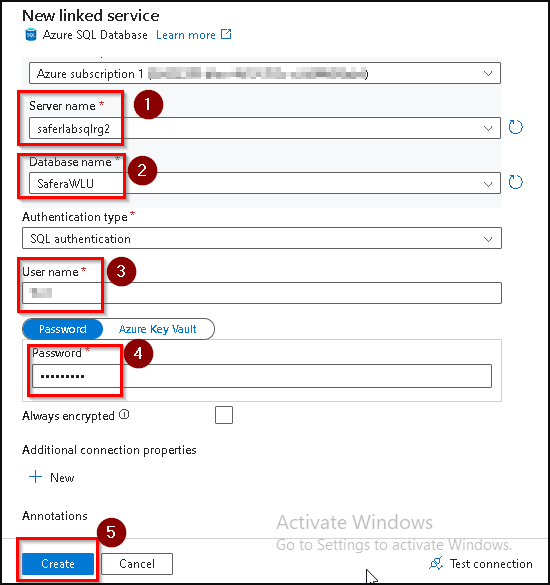
Select Server name and Database as shown below from the drop down
*Note- THe Server name might differ to that of the snip below as it will be based on your login user number so it might show saferalabsqlrg1/2/3.., so select which ever server is showing to you in the drop down.
Use the SQL Authentication option and enter the userID and password supplied by the Lab facilitator for the SQL connections.
Click on Create.
- Once the Linked service is created you will be redirected back to the dataset property window.
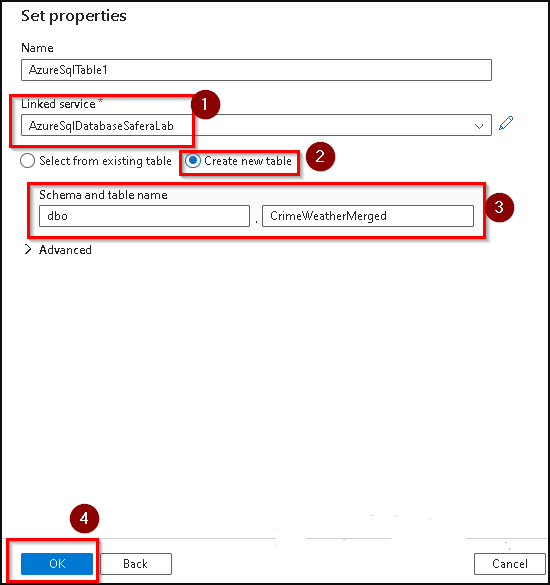
Here now you can now see the Linked Service which you have just created.
Select Create New Table.
Enter the schema and table name as dbo.CrimeWeatherMerged respectively.
Click OK.
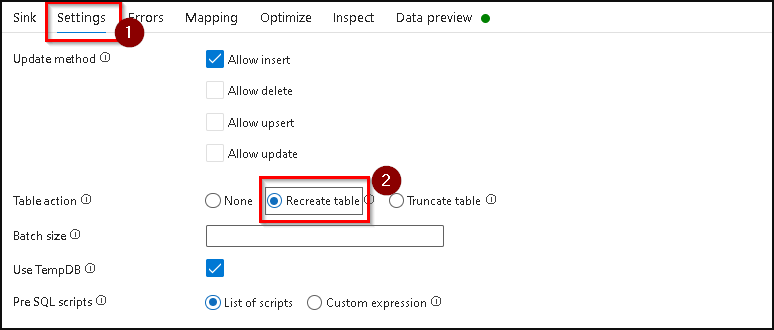
39. Now in the Sink settings.
Ensure the Allow insert option is selected and Recreate table option under action section as to drop and recreate table each time of execution.
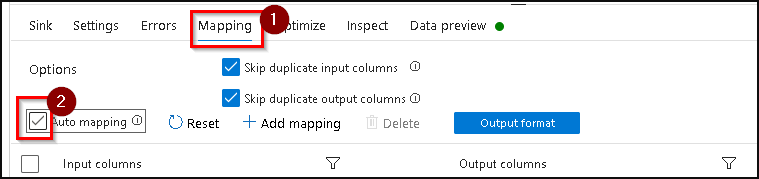
40. Keep all the options under the Error tab unchanged and then move to the Mapping tab where you can see all the input to output mapping.
By default the system will try to do Auto Mapping but if you find any message as below which shows some mapping are missing then we have to set those manually.
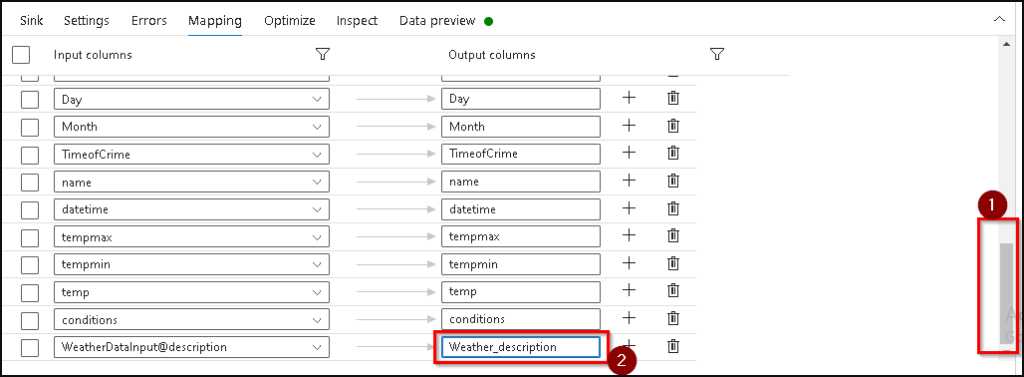
- Scroll Down till the bottom on the same mapping tab.
Rename the last column as Weather_Description
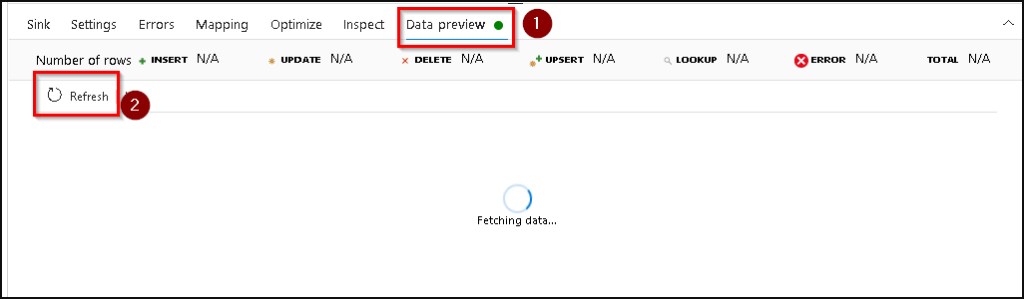
- Now we can Click on the data preview tab.
Click on Refresh and it will start showing the preview.
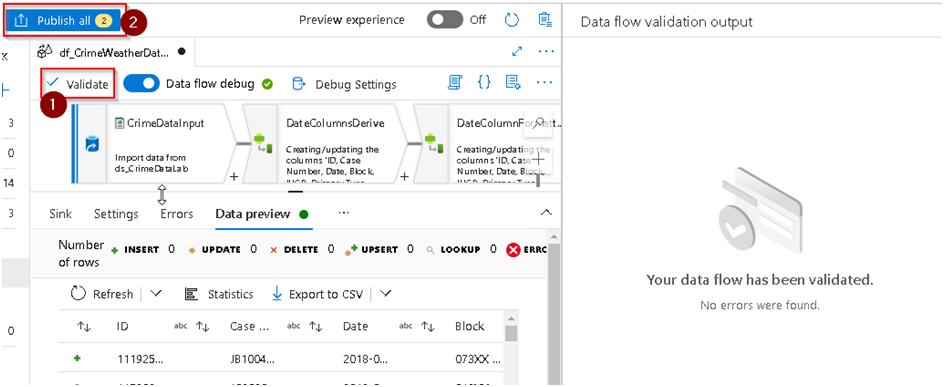
Once satisfied with the result set Click on Validate option to see if the code/flow is complete and error free and if everything is fine then we can commit the changes by using the Publish option at the top.
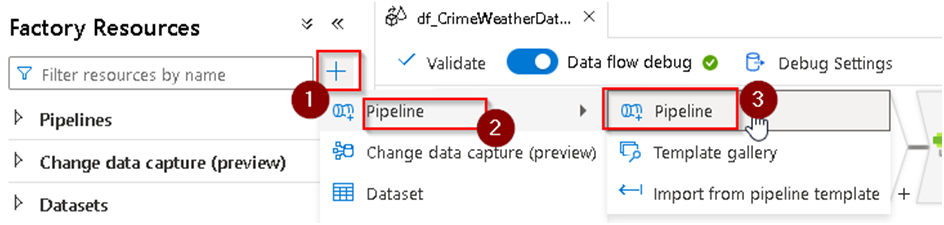
43. Now our Dataflow development is complete and we can proceed with the development of a pipeline which will be used to run the dataflow. So for this under Factory resource Click on + to add a pipeline as below. Note- A pipeline is a logical grouping of activities that together perform a task. For example, a pipeline could contain a set of activities that ingest and clean log data, and then kick off a mapping data flow to analyze the log data.
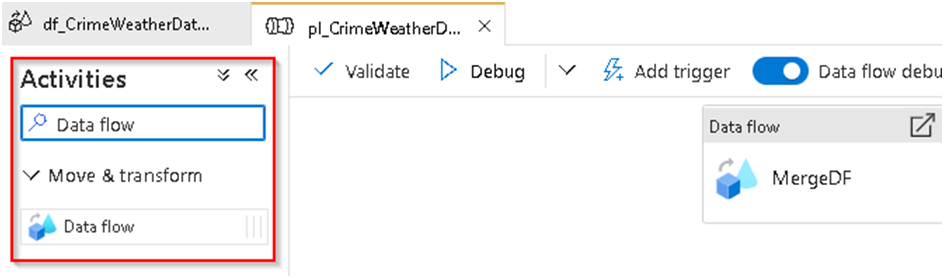
44. Search for Data flow under the activity section and drag and drop the object into the blank pipeline canvas and after selecting it under general section we can name it as MergeDF
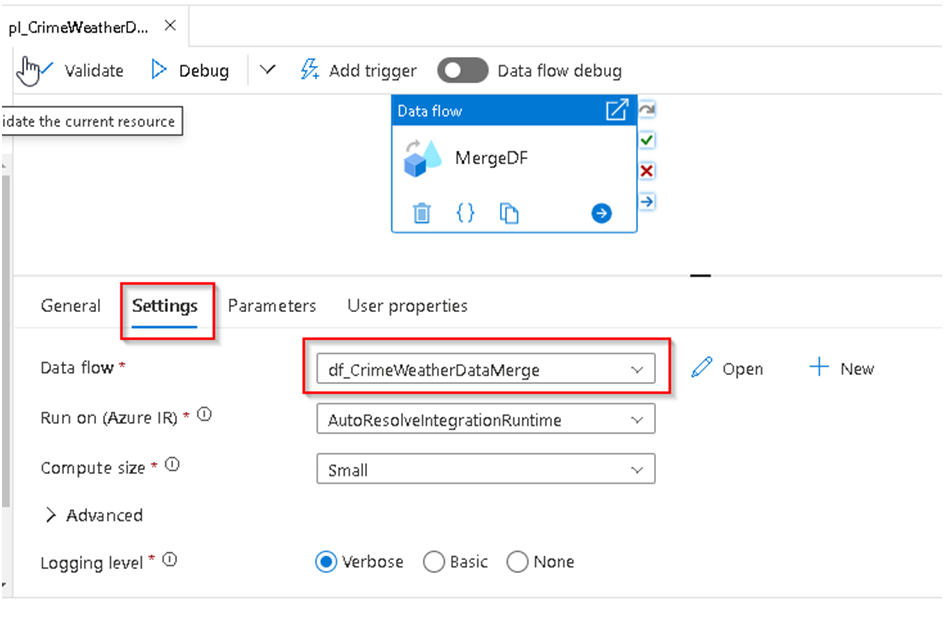
45. Select the Dataflow and under General Section update the name of it and under settings we will select our dataflow which we have created to be executed inside it.
46. Validate the dataflow and once successful we can Click on the debug option to do a debug execution of the pipeline/dataflow else after publishing we can trigger the pipeline.
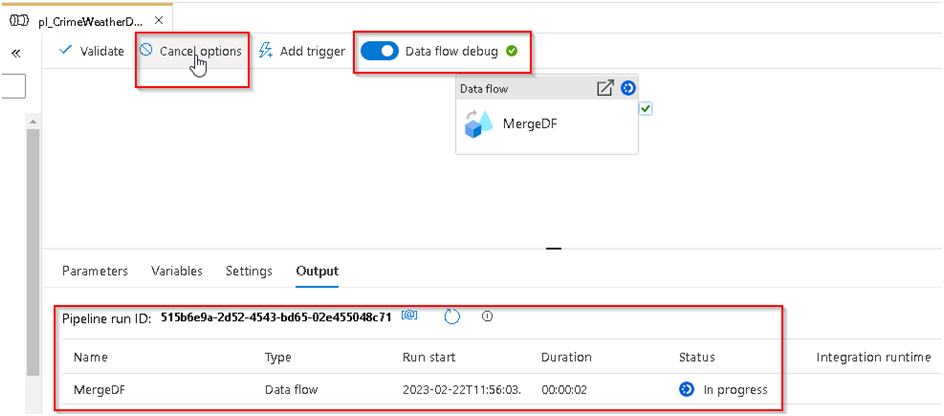
47. For now we will use the debug execution option, so ensure that the Data flow debug option is enabled and then if you click on Debug it will start the run as below and you will get the run status below in the output section and Cancel option as well at the top.
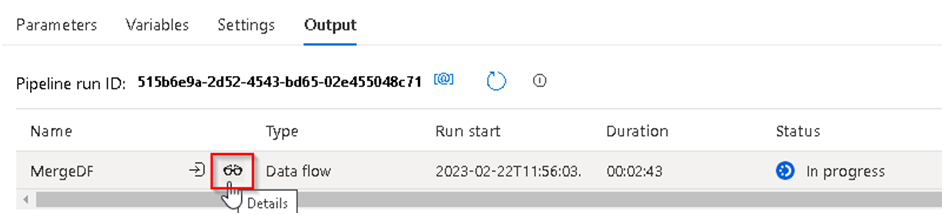
48. We can see the detailed execution process that shows us which step is currently executing in the monitor window and for that we can Click on the details button and this will redirect to monitor section.
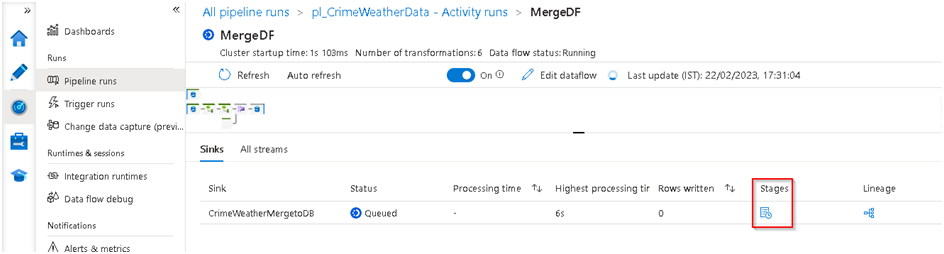
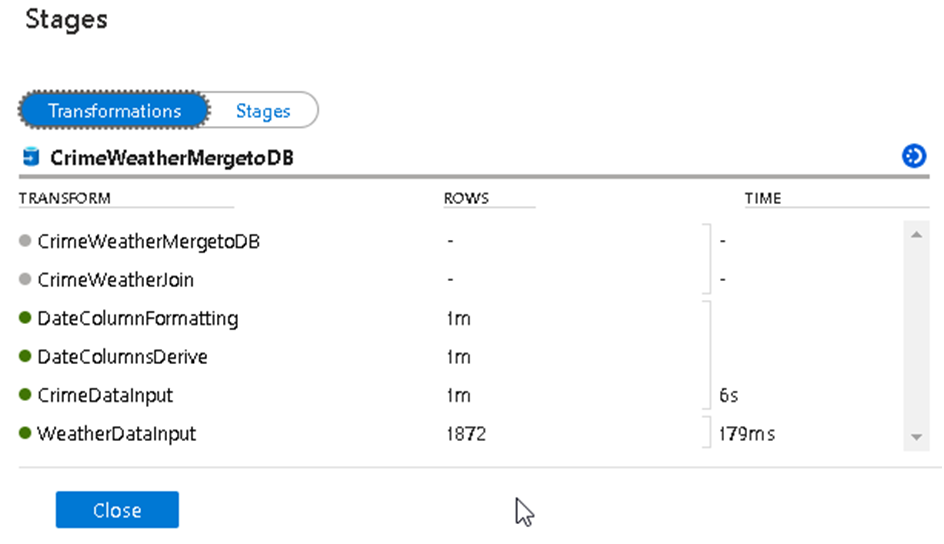
49. We can Click on the Stage option to see the actual point of execution
50. The execution will take around 10 minutes to complete and once completed successfully, Publish the final changes to Azure Data Factory from the top option.
51. This completes the Lab-1 activities as you have successfully inserted the data into the target Azure SQL table to be used as source in subsequent labs.